Trading Articles
Reducing The Subjectivity Of Elliott Waves By Ian Copsey
Is the identification of Elliott waves too subjective? This method can reduce the subjectivity and improve your ability to forecast.
INTRO
The Elliott wave theory appeals to some and not to others, that goes without saying. Some adhere to it strictly, while others play it by ear, not staying too close to the rules and just keeping an eye out for five-wave moves. If you have wondered if there’s something just a little bit off about the strategy, you may be right. It may be Ralph Elliott made a misjudgment in the impulsive wave structure.
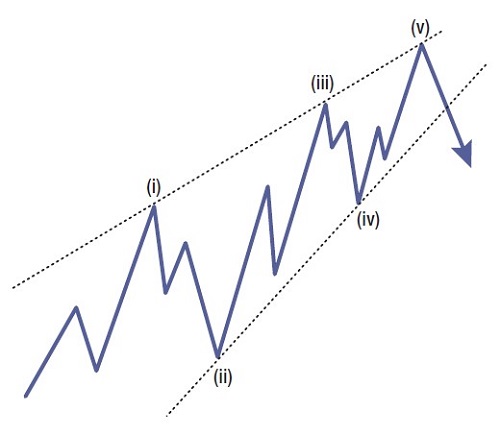
Through some work I was doing with the theory, I became aware of a “special wave A” move that Elliottician Robert Prechter noted in 1986 (Figure 1). A diagonal triangle wave development, which is normally associated with an extended wave 5, was occasionally seen in a wave A position. What I was facing, however, was a five-wave move that developed in a similar manner to a diagonal triangle, in which waves (i), (iii), and (v) all developed in three waves, not five. From this we could infer that any individual five-wave move could only develop in a wave A position or a wave C position. In the next higher degree, this ABC sequence formed one section of a larger five-wave sequence all constructed of three-waves.
What I found was that everything fell flat if I applied a Fibonacci relationship to the standard count that would treat these as an example of an extending wave. When I used the three-wave structure for waves (i), (iii), and (v), however, the wave relationships turned out to be perfect. Adjusting the structure this way, I found projections and retracements began to be consistently accurate.
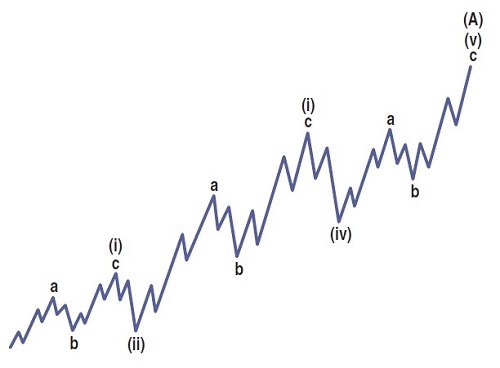
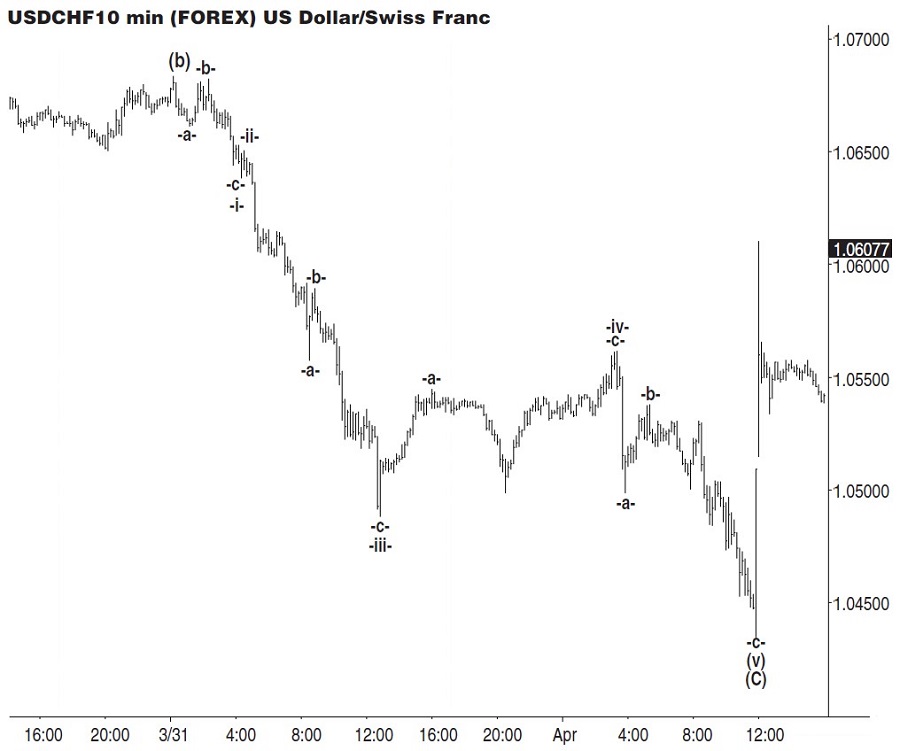
Figure 2 displays how the harmonic impulse wave now appears. Waves a and c are constructed of five waves each. In contrast to the five-wave impulse move found in Ralph Elliott’s original version that could form 1, 3, 5, A or C waves, the harmonic version can only form waves A or C. Figure 3 displays a five-wave decline in US dollar/Swiss franc (USD/CHF). Elliotticians would declare this to be an example of an extending wave 3, but the key to confirming this structure is through the wave relationships. Before I proceed, let me explain how Fibonacci and harmonic ratios work.
FIRST OF ALL, FIBONACCI
I’m sure I don’t have to mention, but to refresh your memory, the popular Fibonacci retracement ratios are 38.2%, 50.0%, and 61.8%. For projections, 161.8% and 261.8% are popular. Using the same methodology, we can derive a whole range of ratios, both above and below 100%:
Below zero:
- 5.6%, 9.0%, 14.6%, 23.6%, 33.3%, 38.2%, 50%, 61.8%, 66.6%, 76.4%, 85.4%, 90.0%, 94.4%
Above zero:
- 161.8%, 261.8%, 423.6%, 685.4%, 1109.0%, 1794.4%
THEN THERE’S THE SQUARE ROOT OF 2
Geometrically, the square root of 2 is the length of a diagonal across a square with sides of one unit of length; this follows from the Pythagorean theorem. Its numerical value truncated to five decimal places is 1.41421. At first I wasn’t quite sure how to use this until I noted that two derivations of the number frequently occurred: 41.4% and its “opposite,” 58.6%, which is 100 – 41.4.
I noted the common relationships between waves that are generated directly from Fibonacci and the square root of 2 with trending projections tend to cluster around certain ratios, while corrective ratios in wave (c) also had its own clusters. Specifically, with wave (iii) it is possible to take the ratios less than 100% and add them to 100%, 200%, and occasionally 300% and 400%, which generated projections of:
- Mostly common extensions in wave (iii): 176.4%, 185.4%, 194.4%, 223.6%, 261.8%, 276.4%, 285.4%, 295.4%
- Mostly common extensions in wave (c): 85.4%, 95.4%, 100%, 105.6%, 109%, 114.6%, 123.6%, 138.2%, 161.8%
WAVES AND THE HARMONIC STRUCTURE
What we have to remember is that the key to the harmonic wave structure is for all degrees of the structure to develop with relationships that confirm each other. For example, wave (c) must be related to wave (a), wave (iii) must be related to wave (i), and the wave (c) of wave (iii) must have the same target areas. Within the wave (c) of wave (iii), wave v must also develop with a ratio that confirms the same targets as the projection of wave (iii) and the projection in wave (c). The relationships that can be seen in Figure 3 of the USD/CHF are echoed in Figure 4.
As can be seen, the wave relationships shown are remarkably accurate. Note how the internal ABC relationships confirm the projections of waves i through wave v.
Suggested Books and Courses About Elliott Wave Analysis
FOLLOWING NATURAL RATIOS
Elliotticians will tell you that market movements follow natural ratios and therefore the sequence of waves in a structure should reflect this. However, the current structure fails to do so. In wave theory, the harmonic wave structure calls for there to be in wave relationships:
- Wave c in wave (i) should be related to wave a
- Wave (ii) should be related to wave (i)
- Wave (iii) should be related to wave (i)
- Within wave (iii), wave c should be related to wave a and match the target in wave (iii)
- Wave (iv) should be related to wave (iii)
- Wave (v) should be related to a ratio of the beginning of wave (i) to the end of wave (iii)
- Within wave (v) wave c should be related to wave a and match the target in wave (v)
Applying these tenets to the wave structure can satisfy most wave theorists. Figure 5 shows a decline in the hourly GBP/USD market. The upper chart has been labeled with a logical wave count under Elliott’s description of the wave structure. This appears to decline in a complex five-wave move in which wave (3) has a double extension. Other than the correction in wave (2), all the swing highs and lows are declining, confirming a bearish move. This decline followed a previous move lower, and thus, another five-wave decline looks likely.
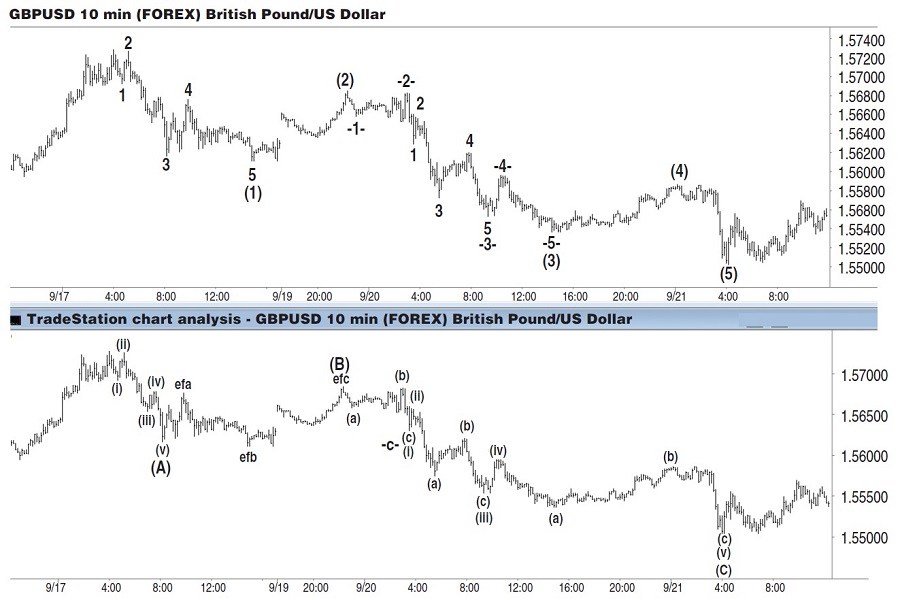
The decline in wave (1) follows the classic Elliott structure of five waves, with wave 3 the longest and providing the main thrust of the decline. The correction in wave (2) appears normal, and this is followed by a wave (3), which has extended twice. Wave 2 is an expanded flat.
But that’s not to say that there aren’t problems in the structural development. First, these extended waves tended to lack consistent wave relationships, generating the second problem, being able to forecast where price could stall. The lower chart labels this as a three-wave decline. Elliott wave practitioners will question this, but the count can be confirmed through the wave relationships, which in this case provide accurate ratios.
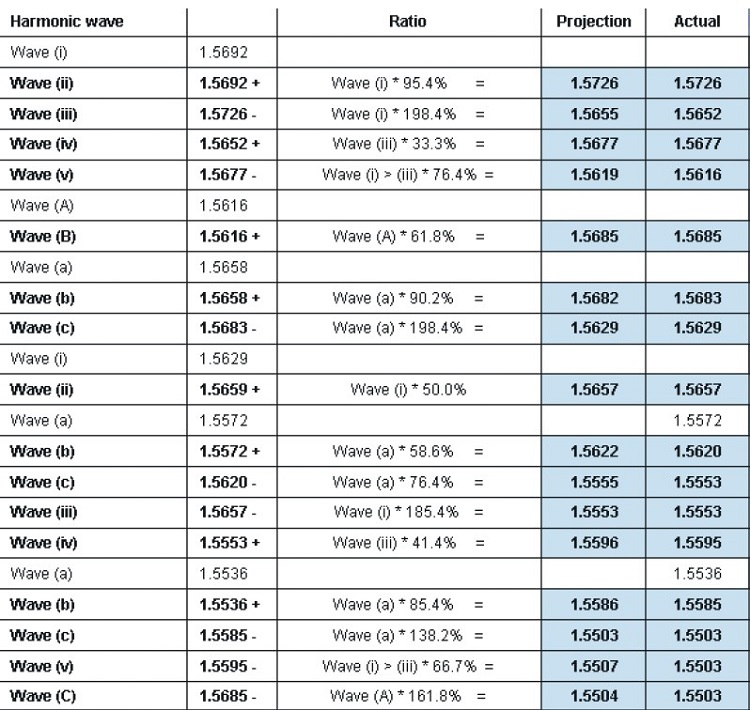
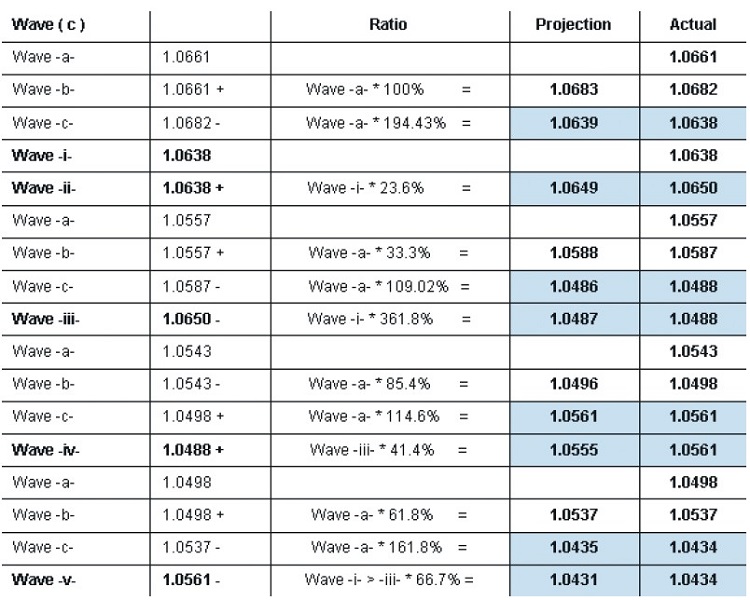
Figure 6 shows a mixture of wave relationships, those implied by Elliott’s original wave structure. While there are some with the normal wave relationships I am usually in search of, I have highlighted some that would have posed serious issues in forecasting. It was this type of imprecision that was difficult to accept. On many occasions, being unable to identify turns within a reasonable margin left me wondering whether it was a correction or a reversal.
The relationships in the harmonic wave structure can be seen in Figure 7. The clarity of the wave relationships stands out from the first five-wave decline in wave (A). Every relationship is common for its own position, the 198.4% projection in wave (iii), the 33.3% retracement in wave (iv), and the 76.4% projection in wave (v), with maximum variance only three points.
The wave (B) correction developed as an expanded flat, with the pullback exactly 61.8%. These relationships continued throughout the decline, even to the end, where the extension in wave (v) of wave (C) was only four points, while the projection in wave (C) was a point away from the exact 161.8% projection of wave (A). From that 1.5503 low, price raced higher contrary to Elliott’s structure.
IN OTHER MARKETS
My examples here have all centered in the forex market, since that’s where I have worked for most of my 28 years in the business. Because I am not as familiar with them, other markets have not been as easy to apply Elliott wave theory. The harmonic wave structure has changed that, however, and suggests once again that it reflects the correct impulsive structure through all markets. I have made accurate forecasts in equity markets and gold to confirm that the harmonic wave structure is applicable to many, if not all, markets and time frames.
A FORECASTING TOOL
I have tried to give some solid examples that Ralph Elliott made a misjudgment in the impulsive wave structure, but his oversight is understandable, given the limited resources he had without being forced to make extensive manual calculations. There is something that must be emphasized, and that is that the harmonic wave structure is not a holy grail; a strong element of subjectivity is inevitable, specifically when waves (i) and (ii) are difficult to identify with any certainty. But the requirement for wave relationships reduces the level of subjectivity compared to the original structure. The harmonic wave structure provides a stronger framework on wave recognition and improves the ability to forecast.
Ian Copsey is a veteran technician and provides his harmonic daily forecasting report on the forex market. He may be reached at www.harmonic-ewave.com.