Trading Articles
Candlestick Patterns, Volume, and Relational Analysis in Trading
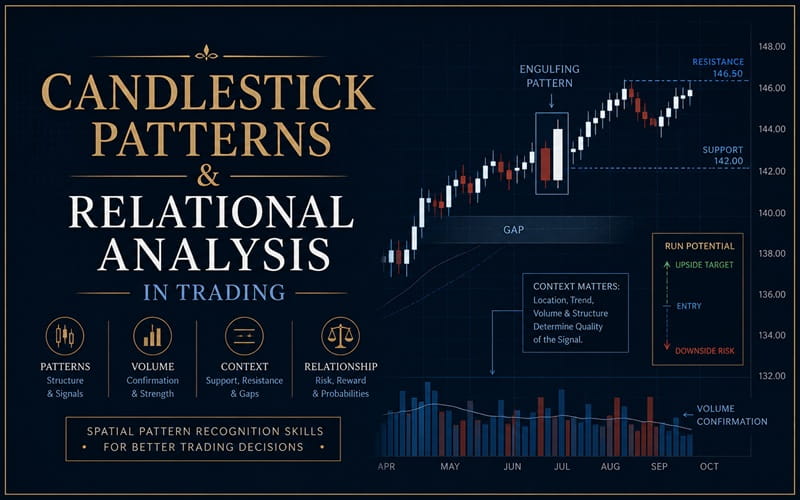
There’s more to chart patterns than merely identifying them. Find out how you can see relationships between candlestick bars and patterns to better assess what price is likely to do. Pattern-recognition skills are a trader’s most important chart analysis asset. Since the introduction of Japanese candlestick charts to the West in the late 1980s, they have become the most popular and most-used price plot style by both retail traders and professionals, and with good reason. Candlesticks are the easiest of all the chart styles to read and recognize. However, just learning the basic candlestick patterns taught in numerous books, DVDs, and articles is not going to make a trader consistently successful in the stock market. What can help is going beyond the basics of the candlestick books and patterns to apply a technique I named Spatial Pattern Recognition Skills (SPRS), which I will describe here. This technique can provide far more in-depth analysis quickly and accurately.
Beyond Candlesticks
Learning the candle patterns is the first step, but it shouldn’t be the last. For example, everyone using candlesticks knows and can identify an engulfing white candle pattern. For some traditional candlestick advocates, an engulfing white is a continuation pattern confirming a moving average convergence/divergence (MACD) buy signal. For others it is a buy entry signal for a swing or daytrade. But how often do the engulfing white candles perform as expected? That depends on where it forms in relation to prior candlesticks, and its dimensions in relation to the other candles nearby.
This method of analyzing candlesticks is something I named Relational Analysis (RA). It employs SPRS to evaluate the strength of the candle pattern, the probable magnitude of the price action, and the effect on the short-term trend at that time.
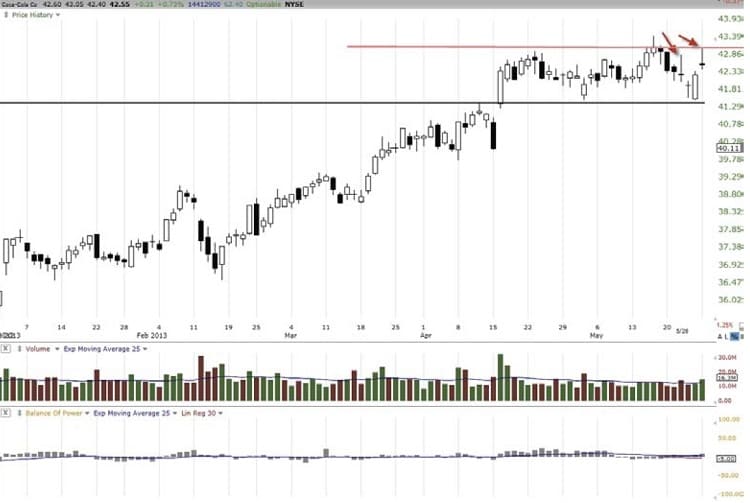
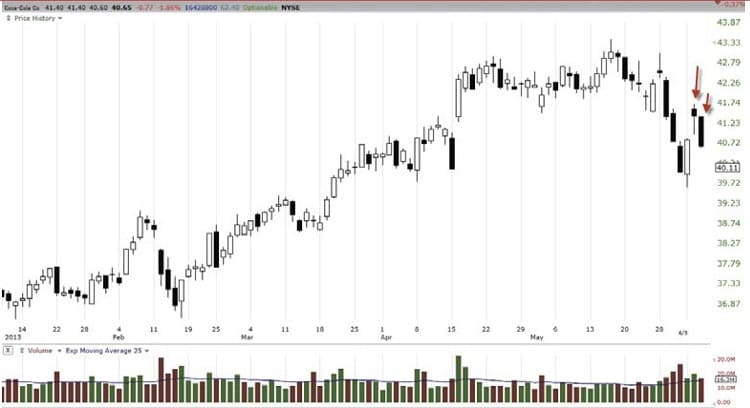
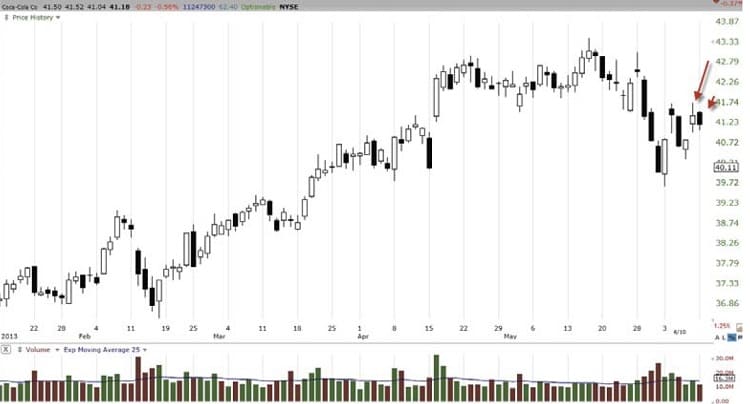
I’ll walk you through how to use SPRS to employ my RA method on the chart of Coca-Cola Co. (KO) in Figure 1, which has an engulfing white candle. The engulfing white has a small wick and minuscule tail, which are an upper and lower shadow. This is considered a stronger engulfing white than one with long wicks and tails, but does this engulfing white confirm an upside move? Does it expose strength? Is the next candle going to resume the uptrend? Is this stock poised for an upside breakout price action?
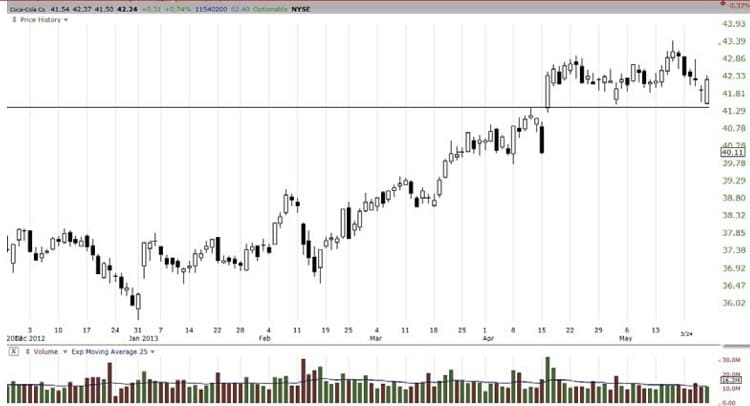
Looking only at the engulfing white candlestick limits your view of what is going on with the chart. But by incorporating SPRS, you begin to see relationships among the candles and are able to better assess what price is likely to do next. By stepping back to look at the big picture, the first observation should be that this stock was moving sideways. The second obvious aspect of price action is that this stock tends to gap often, and the gaps tend to fill or attempt to fill.
The third observation should be the comparison between white candles and black candles. As the stock moved up, which candles dominated the other, the white or the black? Using techniques to recognize patterns based on spatial relationships, the answer becomes apparent. The black candles are longer most of the time, with smaller candles on the short-term upside runs. This represents large lots quietly rotating out of this stock with incremental orders that allow smaller lots to push price upward before their orders trigger.
Note also that the runs are shrinking in points gained, which means the pull of the large-lot sellers is strong even though this stock is moving upward. Candles get smaller and smaller when large lots are selling and smaller lots are buying. Next, the sideways move itself can be evaluated by determining which side dominated during this sideways action, the buyers or the sellers. In this example, it is the sellers. The buyers could not get any traction and were unable to move price out of this sideways pattern. Instead, price was stuck. Any time price moved beyond the first high, it continued to move up, but it ceased selling as price dipped down to the support gap of April 16.
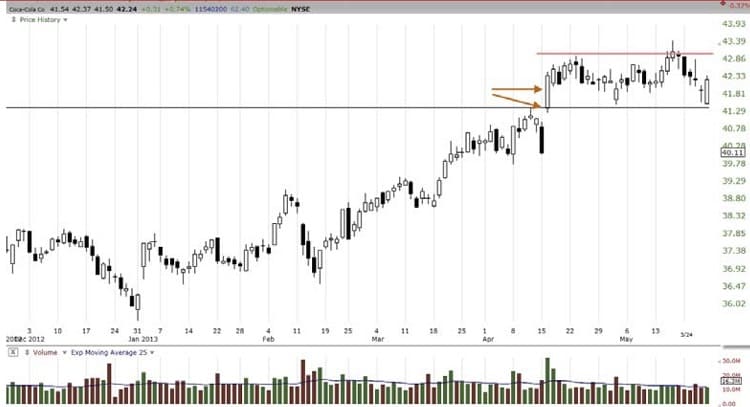
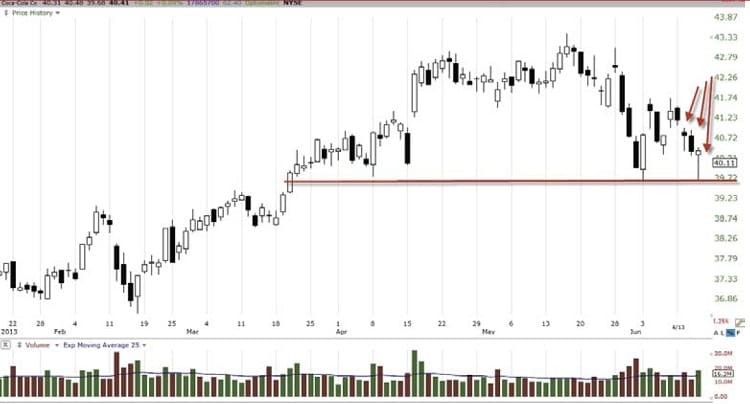
The final comparison for this analysis is to compare the most recent run gains as total points versus the number of points for the engulfing white (Figure 2). The longest engulfing white rose 1.13 points in one day. The longest run in the sideways pattern is 1.42 points. Based on average run gain potential within this sideways pattern, the engulfing white has used most of that point potential. Resistance is also a factor and is the first highest high of the sideways move, which is 42.96. The engulfing white high is 42.37, for a total point-gain potential of 0.59, so less than a point. Risk-to-profit potential is a negative, with two points of risk to a 0.59 gain. Risk is calculated on the support level below the gap white candle to the point of entry. Intraday stop-loss is a high risk due to the intraday resistance caused by the higher lows from the sideways pattern in May.
Don’t Ignore Volume
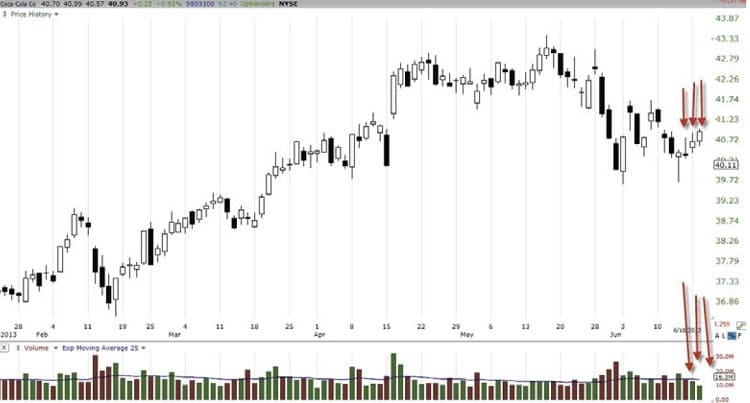
Volume matters a great deal when it comes to Relational Analysis. It is one of the three data-streams from the market, and plays a critical role in the analysis. Using an exponential moving average (EMA), you can see that the volume during the sideways move is slowly declining. The only volume above the EMA during the sideways pattern is red volume on down days. The engulfing white has lower volume than the previous two days (Figure 3).
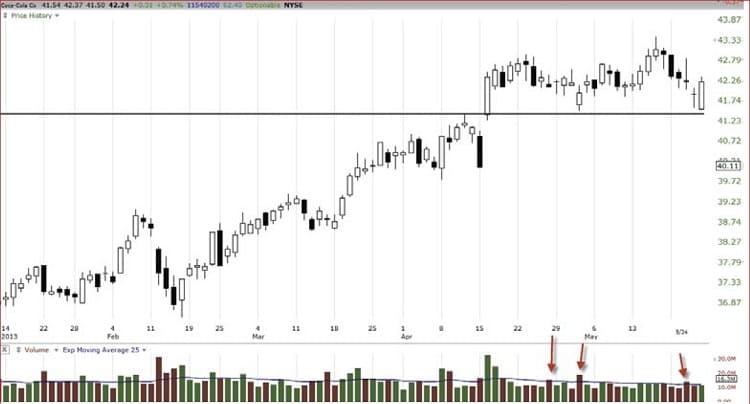
This information suggests that it is the sellers who are dominant, even though you see an engulfing white candlestick. The large lots are selling and smaller lots are buying. At some point, a shift in sentiment will cause a huge imbalance in order flow and the large-lot sellers will take the stock down. Thus, this particular engulfing white is neither a confirmation nor an ideal entry signal to buy the stock for a short-term trade.
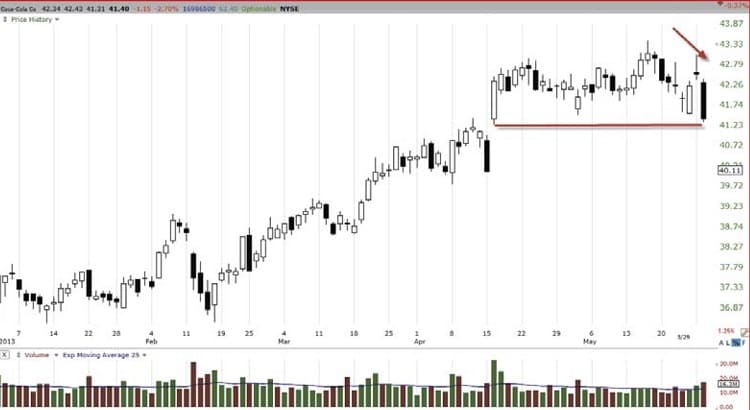
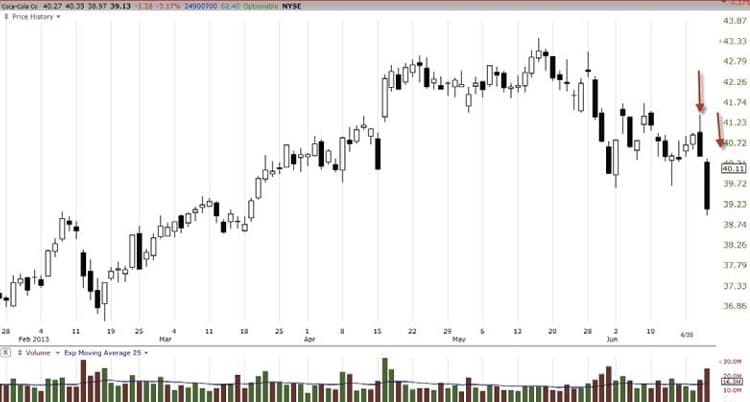
Based on what you have seen so far, you can conclude that the risk of this trade for swing and intraday trading is high. The probability of this engulfing white creating a breakout move is below 10%. The stock formed a common tiny gap that filled quickly as smaller-lot buyers rushed to buy the stock due to the engulfing white pattern (Figure 4). The stock ran up to the resistance level, with large lots letting it move up, and then the selling commenced, driving the price down. For a swing trader, this stock is not sitting at a loss. There is now more downside risk for position and longer-term traders.
The next day the stock drops (Figure 5), gapping down and engulfing the white candle, forming a tower-topping pattern. But support from the April 16th gap holds the stock at that level. This is a technical pattern that means that professional technical short sellers moved in and added to the selloff. For swing traders who hoped and waited, holding this is now a big loss.
The next question is, “Will it go down more or will this support level hold?” Volume is building to the downside, there are large lots selling as they rotate out of this stock, and there are short sellers trading short-term. The reversal pattern formed a lower high, support is not strong, and the price was driven up by smaller lots to this support level. The shift of sentiment has occurred to the downside.
The stock had a wonderful downward run on rising volume to the downside—a near-perfect sell-short pattern with limited overlap of the downside price action (Figure 6). This is the combination of large lots selling to rotate out—professional short sellers, few retail traders, and high-frequency trader action. This selling is controlled, with smaller buyers getting wiped out quickly.
Then another big engulfing white forms. Is this the candlestick pattern that will reverse the trend? It has a longer tail, downside shadow, and almost no wick. Here is where Spatial Pattern Recognition Skills using Relational Analysis can make a substantial contribution to the overall assessment of this engulfing white. A prior candle with a similar pattern and size immediately stalled as large lots sold with a rotational order. In addition, check the volume in relation to prior volume on the downside.
Advanced Books and Courses on Candlestick Patterns
Then check the resistance level, which is the gap of April 16 for this particular engulfing white. What is the risk versus profit potential? Relational analysts would ask, “Does this candle have sufficient volume and points to gain prior to resistance for a profitable swing trade?” The answer to this question for this chart is “no.” Buying the stock on this engulfing white with continued selling by large lots increases the risk of this entry.
- Learning the candle patterns is the first step, but it should not be the last.
The next day (Figure 7), smaller lots take the bait and gap the stock up, only to have the large lots sell, bringing the price down. This would have been another disastrous buy entry for the engulfing white candlestick swing traders.
- By incorporating SPRS, you can begin to see relationships among the candles.
The nesting black candle is followed by a small white candle (Figure 8) that exposes the weakness of the smaller lots. The up move fails as price closes lower than it opened, which is a big part of the analysis for the next day. It also gapped slightly, and it is likely that the gap will get filled. If the gap gets filled it’ll be very risky, and as you can see from the chart, that’s what happened.
Then a gap-up indecision day occurs, followed by a small engulfing white. What is happening is the quiet distribution by the large lots continues as smaller lots buy on the dip, but the buying is weakening and the pattern shows extremely shallow depth for the buyers. Sentiment remains to the downside with the large lots continuing a carefully orchestrated selloff totally in their favor. For swing traders, this type of pattern is extraordinarily challenging for good, consistent profits.
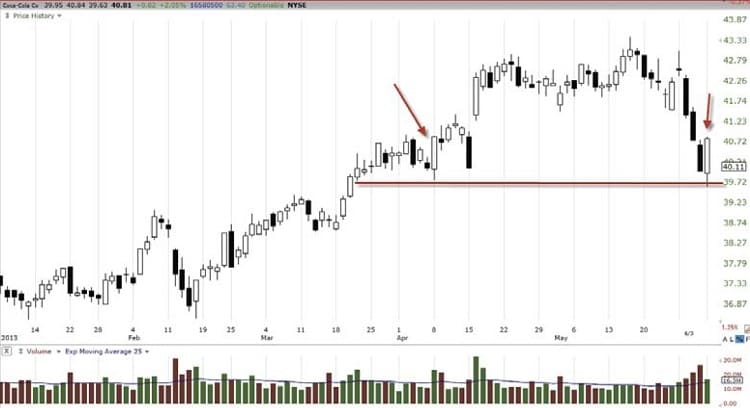
Volume on the engulfing black is lower, but all relational analysts know that stocks can fall on lower volume, and sustained moves upward require increasing volume for the runs. What forms the next day is another indecision day followed by a gap down (Figure 9). Now the sellers and short sellers are overwhelming the smaller-lot buy-on-the-dip investors and traders. The stock runs down and back up intraday with another reversal candlestick pattern on rising volume, almost precisely at the prior low of the engulfing white candle. This is a buy-to-cover candlestick pattern with some buy-on-the-dip smaller lots. This combination causes volume to rise.
The chart in Figure 10 shows the final exhaustion pattern of the smaller-lot buyers. Volume is evaporating as price moves up. Large-lot institutions that were rotating out quietly are no longer doing so.
The stock rises on vapors with candles that are small and shifting sideways with some overlapping, which is obviously a weak pattern. As the smaller-lot buying disappears, the large lots dominate and once again overwhelm price. The stock plummets through support with ease (Figure 11).
Questions Answered
Incorporating SPRS with my Relational Analysis method gives you much more information than if you were just using candlesticks. Many retail traders grumble that they can’t trade against the high-frequency traders or dark pools, automated trading algorithms, and professional low-latency trading systems. However, if a trader takes the time to develop the type of pattern-recognition skills such as the techniques I’ve described here, and using point-gain run potential, risk analysis, and risk-to-profit potential, these analytical skills and tools will keep him out of weaker trades. It will also help the trader find the strongest patterns for optimal stock trading profits, no matter what trading style he uses.
- Martha Stokes, CMT, is co-founder and CEO of Techni-Trader. She is a former buy-side technical analyst. She has authored over 40 TechniTrader stock and option markets courses for beginners to professionals. She earned her CMT designation with her thesis, “Cycle Evolution Theory.”