Articles
Price Rules By Colin Alexander
This article describes price patterns, or price rules, that call for action when other indicators confirm a buy or a sell signal. Like catching the optimal moment for a surfer riding the big wave, the idea is that you hope to capture the moment when a surge in price may be starting, when there is enough evidence to know that it can start but not so much that the move may be nearer its end than its beginning.
Ways to Enter a Trade
First, consider the options when considering a trade. Some traders simply know they want to be in a market, for whatever reasons, and just go ahead anyway. For a technician, this approach is inherently undisciplined and unreliable. It may work for those who get the trend right and for those who have a commercial need to buy or sell that is immediate or not unduly price-sensitive.
Other traders set targets to buy low and sell high, usually on the basis of identifiable support and resistance levels. Market makers, commercial accounts, and those wanting to trade very big positions use this approach much of the time. For non-specialist traders this approach has its place, and it can work well. However, you don’t know until after entering the trade whether it will in fact start to perform as expected. Therefore, buying low and selling high at a predetermined level generally constitutes a better way to get out of an existing position than it is for entering a new one.
The problem with setting target prices for entering new positions is that you really want to see how a market acts when it approaches the target price and what it does when it gets there. If the reach is temporary and the rebound is strong, it suggests that there may be plenty of people with the same idea. Alternatively, you may see a market reach a target and traders’ attempts to push the price farther runs out of firepower, and the thrust fails from exhaustion. The point of price-rule theory is that you want to see the responsiveness of traders before arbitrarily assuming that the price will not only stop but also turn and start going in the direction of your trade.
At the other end of the spectrum there are traders who buy high on the basis of price exceeding resistance levels, and in the expectation of the price going higher still. They sell low on the basis of a market falling through an identified support level, expecting the decline to continue. This approach tends to be more successful than trying to buy low and sell high, and it shares with the concept of price rules the idea that you want to get onto a bandwagon when you expect it to keep on moving.
How Price Rules Work
The idea behind price rules is that a market shows, by the pattern development of price bars, that it may be set up, subject to overall chart patterns and other indications, to proceed in the signaled direction and, ideally, right away. Enter any earlier, and the market may never start going in the expected direction. Enter any later, and the market may be getting away on you, and the risk may no longer be man-ageable.
Price rules work for charts of all durations, from intraday to monthly, but their most general application for pulling the trigger on a trade is to use them on a daily or intraday basis. Even if there is unfinished business and price has to return toward the bottom of a buy formation or the top of a sell formation, the process of developing a price rule shows, of itself, which way money has been going and is likely to keep going.
Reduced to its simplest terms, a market is likely to continue the next bar in the same direction as a strong close near the top or the bottom of the range. The probabilities increase significantly for price to continue in the indicated direction when a strong close forms part of an apparent behavior pattern rather than being a random occurrence. Price rules are not perfect, and you can enter a trade without a price rule. However, price rules have stood the test of time.
The theory of price rules, when used in conjunction with other indicators, also suggests that market action may be starting a worthwhile move and has not yet developed so much evidence that the opportunity for making money ends just as you think it is starting. Even if price fails to follow through immediately as expected, you can think of the price rule itself as a miniature trading range within which a retracement is tolerable as long as the price doesn’t go against you beyond this range. The price-rule formation generally allows enough room for price to move, within the range generating the signal, without incurring an unacceptable loss if price breaks the wrong way out of the range.
Suggested Books and Courses About Price Patterns

Tick By Tick By TradeSmart University
Original price was: $497.00.$43.20Current price is: $43.20.
The eight price rules described in this chapter follow the same general principles as the ancient Japanese candlestick price bar patterns, discussed in Chapter 5. If your charting program has the capability to switch between bar charts, line charts, and candlesticks, it is useful to compare them. Neither price rules nor candlesticks are sufficiently reliable for use as stand-alone indicators (although some people try to use candlesticks on their own). Both these approaches help in deciding when to buy or sell, provided they are related to the bigger picture.
It is worthwhile to grasp the underlying principles of the price rules before looking at them in detail. Both buy and sell signals are illustrated because it is just as important to know when to sell or when to sell short as when to buy. The rules themselves are not cast in bronze, and you can stretch them occasionally if other indicators suggest that such a move would be a reasonable course of action. The most important thing is to internalize the concept of bullish, bearish, or neutral bar patterns.
Price Rule Principles
- When random buying or selling occurs in the ordinary course of business, price charts show random patterns. When there is a persistent weighting of pressure toward either buying or selling, price charts also reflect this fact. One footprint in the sand says nothing. When a pattern of footprints starts to point the way, start looking for evidence that the trail may continue. Put another way, you want to buy strength and sell weakness, but only when the probabilities favor continuation of the pattern.
- A close at the extremity of a bar’s range suggests that the market is likely to continue in the direction of the strong close when bars have completed a coiling pattern or when there have been several consecutive strong closes in the same direction.
- It is important to act on a price-rule signal as soon as it occurs. The best signals lead to price following through immediately. By waiting for more confirmation, you increase the risk of a retracement as the market moves away from a price-rule signal. Confirming the balance of evidence can be too much of a good thing once a market starts moving, and the market moves away from a manageable stop-loss point 5. After completion of a signal, there may be a retracement that would permit you to enter a trade at a better price. However, the signals that let you do so are often the ones that fail. The best signals often lead to a profit right away. In the long run, it pays to act as soon as a strong price rule occurs.
- A price rule occurring on the weekly chart may signify the potential for a major long-term trade, and even more so on the monthly chart for those markets having long cycles. Signals on daily and intraday charts deliver the signal for pulling the trigger for a trade. It sometimes happens that there are signals occurring simultaneously on monthly, weekly, and daily charts. When this happens, there is a very high probability of a worthwhile move starting right away.
Conditions for All Price Rules
- To complete a price rule, the final bar has to close in the top 25 percent of the bar’s range for a buy signal or in the bottom 25 percent for a sell signal.
- A price rule may take longer to complete than the minimum specified time. Thus it could take four or five bars rather than three to complete a three-bar close rule (rule 1, shown below). Sometimes it can take until the fourth or fifth bar to obtain a close in the top or bottom 25 percent of the bar’s range, thereby completing the signal.
- When price closes in the middle of the range, the result is neutral. Assume the same closing designation as for the previous bar.
- When an emerging pattern is violated, start counting again at the beginning of the formation with a new bar 1.
- When a price signal is completed (and other indicators confirm the action), buy or sell right away. If you miss the signal, don’t chase the market. Wait for a new signal.
- The point of price rules is that the market should ideally keep on going right away in the direction of the signal. The probabilities favor this happening, with the close in the respective top or bottom 25 percentile of the range, but you need to look at the intraday chart to see more precisely how the market closes. There may be many zigzags in both directions between the open and the close. If you are buying, for example, the best scenario would be for the market to open on the low and close on the high. You should be wary of going long when the market opened on the high and then fell away and made a labored rally back toward the initial high without reaching it, let alone surpassing it. It is important to look at intraday chart action as well as the daily bar on the entry day. Similarly, you need to interpret bars on the weekly and monthly charts in the context of how the market has been acting.
Price Rules
1.The Three-Bar Close Rule: A buy signal occurs on completion of three consecutive bars in which price closes in the upper half of the range and the next bar closes in the top 25 percent of its range. A sell signal is the reverse (Figure 4-1). This rule is reliable when market action occurs in a group with three or more bars more or less side by side, ideally with an upward bias indicated by an accumulation pattern, as discussed in Chapter 3. When it occurs as a result of two strong bars running away from the first one, the risk of a pullback and, therefore, of a less manageable risk may increase.
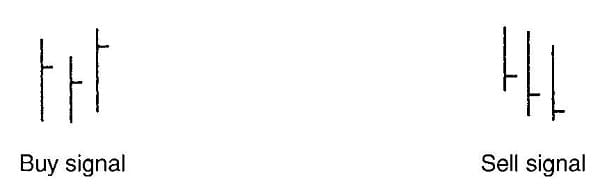
Figure 4-1 The three-bar close rule
2.The Reversal Rule: Shorten the proving time from three bars to two when either of the two bars is a closing-price reversal, key reversal, or high/low reversal (Figure 4-2).
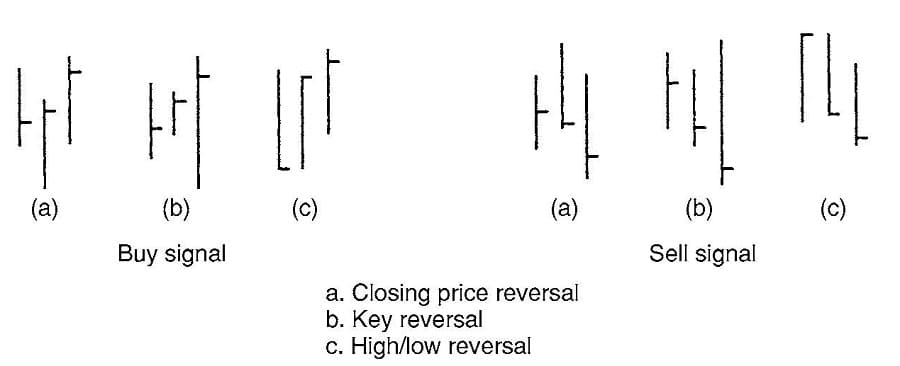
Figure 4-2 The reversal rule
3.The Gap Rule: Shorten the proving time from three bars to two when a gap occurs (Figure 4-3).
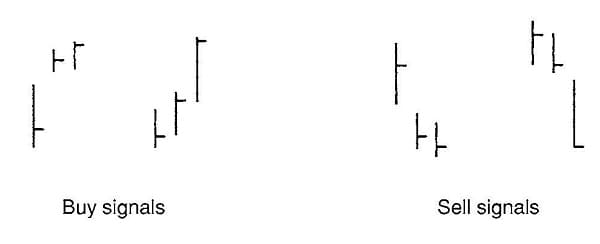
Figure 4-3 The gap rule
4.The Island Rule Shorten the proving time to one bar when an island occurs. It is not necessary for closing price(s) within an island to be in the top or bottom of the range. An island may consist of one bar or many. However, the more time taken to form an island and the more symmetric the gapping, the more likely it is that price has reached an important turning point and will continue in the direction of the new gapping. Islands often indicate absolute exhaustion of the previous trend (Figure 4-4).
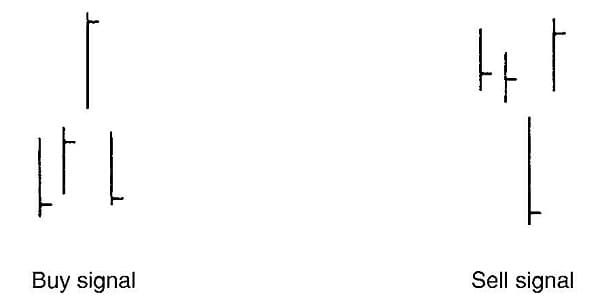
Figure 4-4 The island rule
5a.The Lindahl Buy Rule: The renowned futures trader Walter Bressert popularized this rule (Figure 4-5). Within nine bars from the bar of the low for the formation:
- Price must exceed the high of the bottom bar for the formation: b must take out the high of a.
- Price must then take out the low of the preceding bar: d must take out the low of c.
- To buy, price must take out the high of the preceding bar and close above the preceding bar’s close and the current bar’s opening price (e).
This formation may be completed in as few as three bars or as many as nine depending on the number of intervening bars that do not contribute to development of the formation. Put another way, it is not significant when price exceeds previous highs and lows. There may be several neutral bars in between.
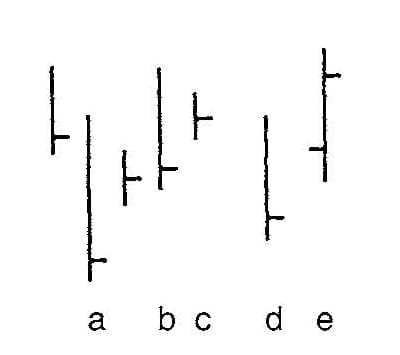
Figure 4-5 The Lindahl buy rule
5b.The Lindahl Sell Rule: Within eight bars from the bar of the high for the formation (Figure 4-6):
- Price must exceed the low of the top bar for the formation: b must take out the low of a.
- Price must then take out the high of the preceding bar: d must take out the high of c.
- To sell, price must take out the low of the preceding bar and close below the preceding bar’s close and the current bar’s opening price (e).
This formation may be completed in as few as three bars or as many as eight depending on the number of intervening bars that do not contribute to development of the formation.
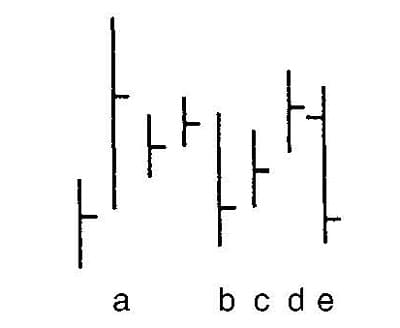
Figure 4-6 The Lindahl sell rule
Walter Bressert found that valid buy signals may require one more bar than a sell signal. Some people find it difficult to grasp the detail of Lindahl signals. It may take time, but it is worth the effort. Lindahl signals are very reliable when other indicators indicate a turn in price. They also occur frequently on charts of all durations. If you have difficulty recognizing Lindahl signals, think of them as looking like a miniature M or W formed by just a few bars. A Lindahl signal on a monthly chart tends to be very reliable because it takes so long to form.
6.The Double-Reversal Rule: Trade on completion of a second reversal bar in the same direction within a period of six bars or fewer, whether closing-price reversals, high/low reversals, or a combination. Both reversal bars should close in the top or bottom 25 percent, as appropriate, of the bars’ ranges (Figure 4-7).
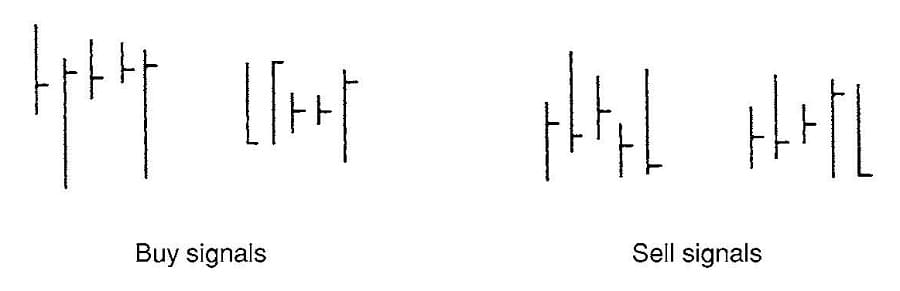
Figure 4-7 The double-reversal rule
As suggested by the name double reversal, this rule is a double trend continuation (rule 8). Double reversals occur often and are very reliable. They also occur frequently in Lindahl formations (rule 5).
When buying, the signal is much stronger if the second low is higher, and when selling, if the second high is lower unless the second reversal is exceptionally powerful. The same goes for closes. Ideally, the second one should be higher when buying and lower when selling. Occasionally, this rule can be completed in as few as two bars. It is very powerful when the second bar completes a double reversal and is also a key reversal bar.
7.The Key-Reversal Rule: Trade with the direction of a single, very big reversal bar—even though the trend appears to be in the opposite direction—hence the name key reversal (Figure 4-8). Make sure that you are familiar with all the components of a key reversal, as discussed in Chapter 3. This rule is particularly useful for getting out of an existing trade even if you don’t want to enter a trade in the apparently new-found direction.
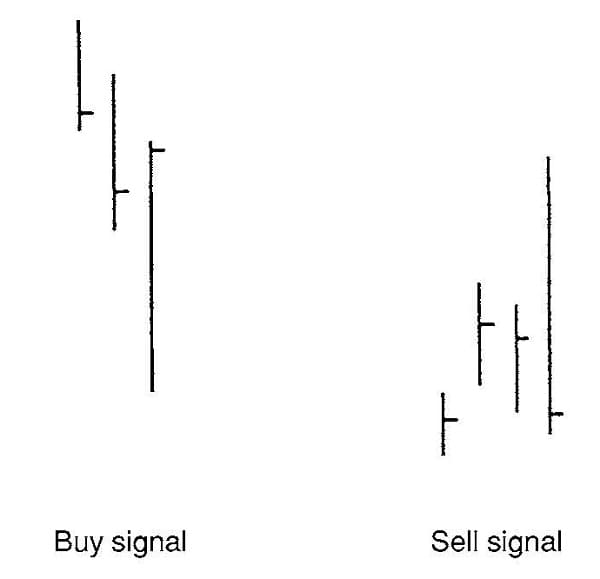
Figure 4-8 The key-reversal rule
Unless the key reversal is exceptionally powerful, it may be better to wait to see whether the market comes back to test the low when buying or to test the high when selling. Even with a strong key reversal, there is a high probability that the low or the high will at least be tested, if not necessarily exceeded. Then there should be a new M or W on the line chart. V tops and V bottoms on the daily chart comprise considerably less than half of all trend reversals.
8.The Trend-Continuation Rule: This is a catch-all for entering a new trade in a rapidly moving market. The point is that the strength of the trend trumps the need to wait for more confirmation. Therefore, shorten the proving time to one bar when there is a single reversal bar, either a closing-price reversal or a high/low reversal, and ideally an outside reversal bar in the direction of an established and unmistakable trend. A clear and unmistakable trend normally requires the 25- and 40-bar moving averages to confirm the direction on the monthly, weekly, and daily charts. Most likely, too, the daily bars will be contained within a 10-bar moving average. It is psychologically difficult to chase a rapidly moving market. This price rule provides the mechanism for buying with both a manageable stop loss and a high probability of making a profit right away.
Illustrating the Price Rules
The day-session-only daily chart for gold between September 2006 and February 2007 illustrates all the price rules, some of them buy signals and some sell signals (Figure 4-9). It does not, of course, follow that you would necessarily have pulled the trigger on every signal, and there are several occurrences when you would almost certainly not have done so.
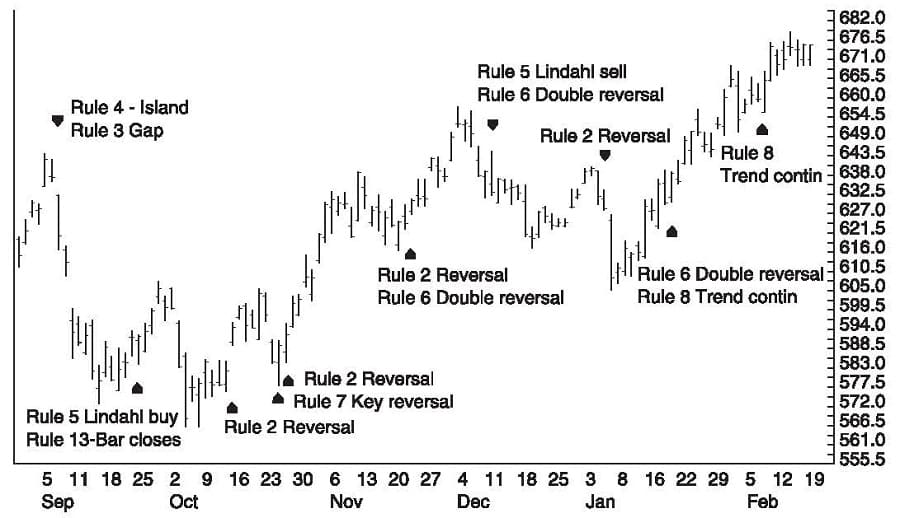
Figure 4-9 Gold continuation daily chart with price rules
You can see that some of the price rules duplicate one another. In fact, the Lindahl buy signal (rule 5a) at the end of September is also a rule 1, a rule 2, and a rule 3 signal.
It is rare to have such a conjunction of price rules, but that does not, of itself, mean that the signal is exponentially stronger. The power of the signal rests just as much on the conjunction of other and different indicators and notably those showing momentum and the direction of the trend. The island top at the beginning of September set off the strongest immediate move over the entire period of this chart. By contrast, the key-reversal rule (rule 7) toward the end of November is, arguably, a bit dubious in terms of both range and power, although it was reinforced by the fact that it occurred after price successfully rebounded from support in the gap left behind a week earlier.