Trading Articles
Testing Next-Day VIX Direction with Reordered Data
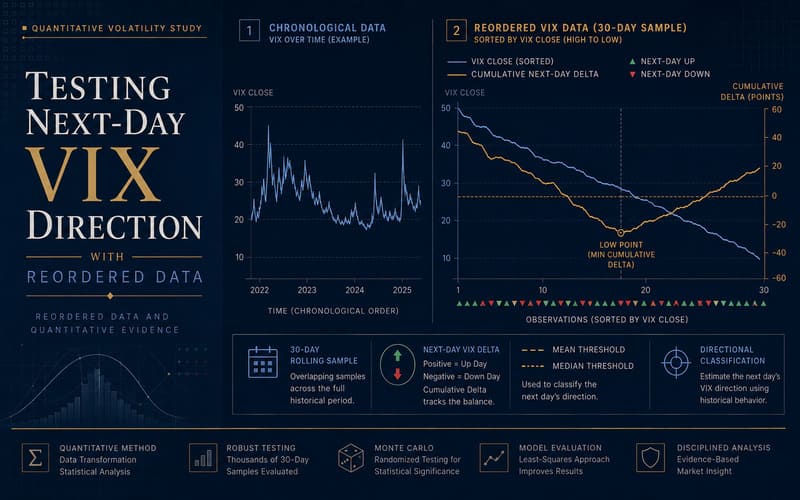
In recent years, the CBOE Volatility Index (VIX) has increased in importance and use as an indicator of market direction. This article demonstrates how the direction of tomorrow’s change in the VIX might be determined by restructuring readily available market data. As usually presented, financial data is ordered in a time series: The data runs from left to right or top to bottom by increasing values of days, months, years, and so on. The data may be altered (with a moving average, lagged values, the log, or square taken, and so forth), but in most cases, data is envisioned and laid out according to the arrow of time. Patterns are then observed or discovered in this time-based framework, and this makes great sense: The factor that may produce tomorrow’s market moves are likely to come from today and previous days.
Recognizing Relationships
But ordering data in just one way limits us. If there are patterns in the data that are not related to the one-directional march of time, we may miss them. This article seeks to explore one of many possible orderings of data from a well-studied, readily-available financial derivative—the volatility index (VIX). My objective is to see if I can discover useful relationships that are hidden in a time series view.
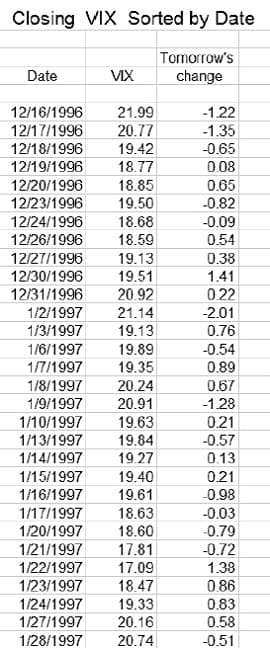
I’ll begin with a small sample of VIX index data from the 30 days of trading between December 16, 1996 and January 28, 1997 (Figure 1). I arrange this data with the date in column 1, the closing value for each of the 30 days in column 2, and the next day’s change in the closing value in column 3.
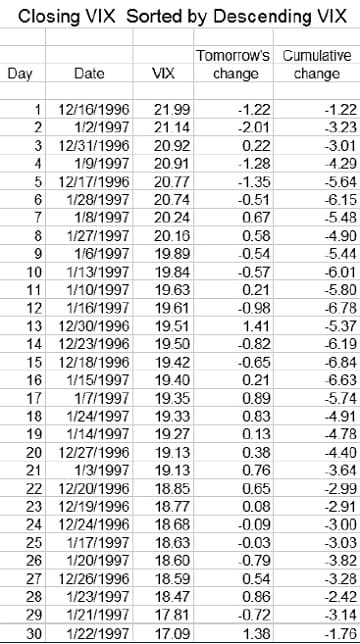
For example, the VIX closed at 19.27 on January 14, 1997 and I put the difference between this close and that for the following day, 0.13, into column 3 for January 14, not for January 15. I then sort all three columns together by descending value of the VIX close and add another column containing each day’s cumulative sum of the next day’s change (see Figure 2). Note that after the sorting, the dates are no longer in ascending order, and that the cumulative change in the VIX is calculated based on the new order of the 30 days. For the sake of brevity, hereafter we will refer to the change in the closing value of the VIX between a given trading day and the trading day immediately after as the delta, and to the cumulative value of the delta when it is ordered according to the scheme above as the cumulative delta.
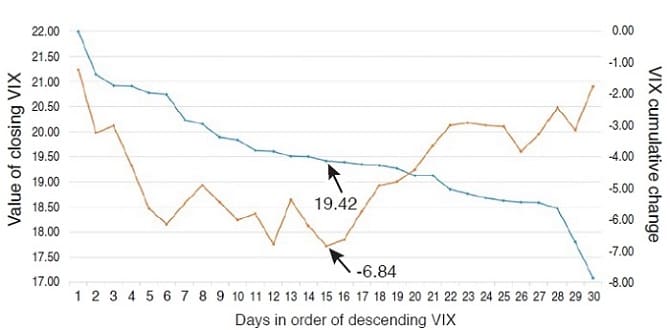
The chart in Figure 3 presents a graph of the descending VIX and the cumulative delta from Figure 2, and it shows a pattern: While the closing VIX values have been sorted to descend steadily from their highest value to their lowest (the 30 days are no longer in calendar order), the cumulative delta values (that is, the next day’s changes in the VIX) generally, but with several detours, drift down to a low point (-6.84) somewhere around the middle of the chart, and then change direction and move upward (with detours) to the last point in the chart. The low point for the cumulative delta occurs on day 15 of this resorted data (December 18, 1996) with a closing VIX value for that day of 19.42.
To the left of and including this low point, more cumulative deltas fall (10) than rise (five), and the sum of the deltas for these (-9.93) is larger in a negative direction than the sum of the rises (3.09) is in a positive direction.
So for every day in this 30-day period where the closing value of the VIX is greater than or equal to the VIX value on the day of the lowest point in column 5 of Figure 2, you would be correct 10 times out of 15 if you were to predict that tomorrow’s VIX will be lower than today’s. And for every day when the closing value of the VIX is less than the VIX value on the day of the lowest point in column 3, you would be correct 11 times out of 15 if you were to predict that tomorrow’s VIX will be higher than today’s. In other words, if you knew the closing VIX for every day in the table and the value of the VIX on the day having the low point of the cumulative deltas, you would predict correctly for 21 of the 30 days for a total of 16.64 points, and incorrectly for nine days for -4.72 points, leaving you 11.92 points ahead. Needless to say, this is a far better performance than the simple 30-day change in the VIX itself, which results in a drop of just 1.76 points over the period.
This general pattern for the reordered data is true for most of the 30-day periods since the VIX has existed. The low point for the cumulative delta is rarely in the exact center of the chart as in the example in Figure 3, and often is skewed well to the left or the right. However, in all 30-day periods since January 1990, for every day with a closing VIX greater or equal to the VIX on the day with the lowest value for the cumulative next day’s change in the VIX (delta), there is a higher-than-average probability that the next day’s VIX will drop. And the reverse is true for all the days when the closing VIX is less than the VIX on the day with the lowest value for the cumulative delta.
How Well Does This Method Work?
The historical database I used for the VIX comprises every trading day from January 29, 1990 to December 31, 2012 and there are 5,749 overlapping 30-day periods in this span. If you predict whether the next day’s VIX change is up or down for the 30th day in each period as per the method discussed, 3,686 of the total 5,713 predictions (that is, 65%; for 36 days, the VIX change is zero) are correct for a net gain of 2,571 VIX index points for the 23 years studied.
Advanced Books and Courses on Market Cycles & Timings


But you want to predict not just the following day’s VIX for some dates in the past, but tomorrow’s VIX today, in real time. Since you want tomorrow’s change in the VIX, you should begin with the 30 trading day period ending today, and then reorder the data as mentioned. Then find which day has the lowest cumulative delta, and note the VIX value on that day. However, remember that for each day in the period, you need to have the next day’s change in the VIX, and of course, you don’t know tomorrow’s number today. Thus, you can reorder the data by sorting them into descending order by each day’s VIX, but you cannot calculate the cumulative change values because the latest one is missing.
The factor that may produce tomorrow’s market moves are likely to come from today and previous days.
The only way to overcome this problem is to bypass it. You need the value of the VIX on the day when the cumulative delta is the lowest for the last 30 days. Without knowing the data from the last day you can use various means to estimate that VIX value. For example, you know from historical analysis that the low points for the cumulative VIX changes tend to cluster somewhere near the middle of the sorted VIX values for each period. Perhaps the mean or the median VIX value for each 30 days would give a fair estimate of the VIX at the low point. In fact, both of them do: If you substitute the mean VIX value (which you know for all days, including today) for the observed VIX at each low point in the historical data, the predictions for the next day’s VIX change are correct for 3,078 (54%) of the days and produce 652 points on the VIX. The chart in Figure 4 shows the cumulative points gained over the 23 years in this case; note that the maximum drawdown for the entire run is less than 60 points.
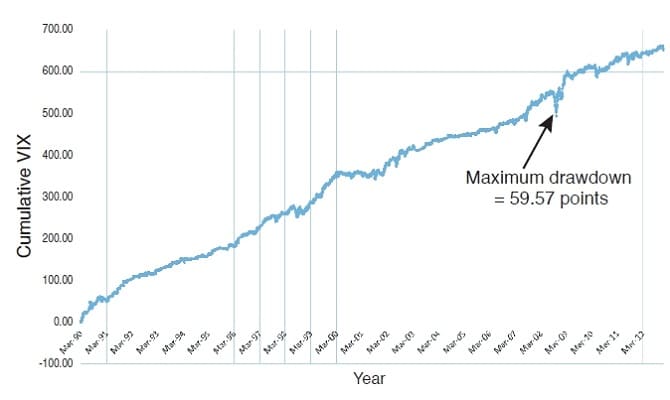
Using the median is almost as good, producing 617 points. Predicting the direction of tomorrow’s VIX with an advantage of 652 points in 23 years may not sound like much until you consider the alternatives. If you were simply to predict for each day over the 23 years that tomorrow’s VIX would always rise or always fall, you would be right about 47.6% of the time for rising and 52.4% for falling, for a grand total of only ±1.91 points. A 1,000-trial Monte Carlo simulation of random predictions for each day in the 23 years shows that you would have achieved a gain of more than 300 points just eight times in 1,000 tries (that’s 23,000 years), and that you would gain a maximum of 361 points just once.
What Will Tomorrow Bring?
In fact, you may get a more accurate estimate of the VIX value needed from the historical data by using more sophisticated statistical methods than simply calculating the mean. With a least-squares approach using multiple variables, I have been able to achieve close to a 900-point gain over the period.
I hope that the information I have presented here will give traders a small but useful advantage in predicting short-term moves in the VIX, and encourage all analysts to take another look at how time-series market data might be rearranged to produce interesting insights.
- Stephen Butts has a PhD in political science. He has worked as a statistical and methodological consultant and teacher at Columbia University, the Bureau of Applied Social Research in New York, and the University of Wisconsin-Madison.