Trading Articles
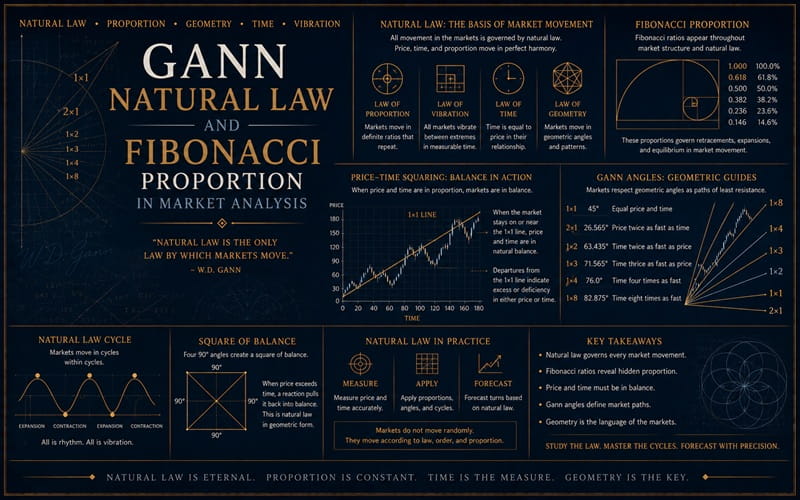
Gann Natural Law and Fibonacci Proportion in Market Analysis
W. D. Gann is without a doubt the most accurate trader ever. Although he wrote several books and courses it is a common belief amongst students of Gann analysis that he never fully disclosed all that there was to his methods. The books he did write are often criticized for being difficult to follow and written in what has been described as a vague and random manor one place that is said to be where he chose to be more specific (albeit somewhat veiled) about his methods was the interview he did in 1909 for Ticker magazine (which later became the Wall Street Journal).
“During the month of October 1909 in 25 days Mr. Gann made in the presence of our representative, 288 transactions in various stocks on both the long and short side of the market. 264 resulted in profits, 22 in losses. We have seen him in one day give 16 successive profitable orders in the same stock 8 of which turned out to be at either the top or bottom eighth of that particular swing. The capital with which he generated was doubled 10 times so at the end of the month he had one thousand percent on his initial margin.”
This is absolutely beyond belief amazing accuracy, excuse me, 16 consecutive profitable orders 8 of which are in either the top or bottom eighth of that particular swing (and he was going to tell you how to do this in one of his books?) If he did leave this information, he didn’t exactly spell it out for anyone. Probably the most common and widely known Gann method that people are familiar with are the geometric angles which are constructed from single significant high and low points on a price chart. The first and most important angle is the 45 degree 1 X 1 angle which represents the 50% diagonal of a square and relates the moving average of 1 price unit per 1 time unit traveled. The next most important above the 45 degree 1 X 1 angle is the 63.5 degree 2 X 1 angle which relates the moving average of 2 price units to 1 time unit traveled and next below the 45 degree 1 X 1 angle is the 26.5 degree 1 X 2 angle which represents the moving average of 1 price unit for every 2 time units or 1/2 price unit per time unit. Gann instructed his students to draw these angles from significant highs and lows and that when prices would come into contact with a geometric angle, price and time were said to be, in his terms, squared, and thus to look for a change in trend at that point. Many have learned to use these angles to find that they can be quite accurate for periods of time, but usually not enough to be solely or consistently relied upon. The concept of squaring price and time is one of the main premises of Gann analysis that he taught his students.
Advanced Books and Courses on W.D. Gann Methods
Now let us for a moment examine some of the quotes he made from the 1909 Ticker magazine interview. “I soon begin to note that periodical recurrence of the rise and fall of stocks and commodities. This led me to conclude that natural law was the basis of market movements. I then decided to devote 10 years of my life to the study of natural law as applicable to the speculative markets and to devote my best energies toward making speculation a profitable profession.” If natural law is the basis of market movement how come there is never any specific reference to the mathematical sequence of numbers and ratios found predominantly throughout nature ever mentioned in any of his published work? Now if you had devoted 10 years of your life to study the markets and you found something unbelievably accurate, would you want to reveal it? Why? What would be the point? You would risk your orders being front run by other traders using the same techniques you developed.
“The law which I have applied will not only give these long cycles or swings, but the daily and even hourly movements of stocks. By knowing the exact vibrations of each individual stock I am able to determine at what point each will receive support and what point the greatest resistance is to be met. Thus I affirm, every class of phenomena, whether in nature or in the stock market, must be subject to the universal law of causation and harmony. Every effect must have an adequate cause. If we wish to avert failure in speculation we must deal with causes. Everything in existence is based on exact proportion and perfect relationship. There is no chance in nature because mathematical principals of the highest order lie at the foundation of all things.”
This could possibly be construed as being a reference to the mathematical sequence universally found in nature (and finally…”stocks like atoms are really centers of energies therefore they are controlled mathematically. Thus to speculate scientifically, it is absolutely necessary to follow natural law.” Keywords? controlled mathematically, absolutely necessary and natural law.
In addition to representing the open high, low and close for a given time period a price bar on a chart could also be said to represent the mass collective mathematical recording of the human psychological and emotional responses mainly; optimism, pessimism, fear and greed and thus a reflection of human nature. Therefore we would look to the mathematical sequence found in nature to measure; “exact proportion and perfect relationship.” In case if you haven’t been; please let me introduce you to Fibonacci de Pisa (Italy 1124 a-d.) the man currently credited with rediscovering what was already known approximately 3700 years earlier at the time of the building of the great pyramid in Giza in 2623 B.C.; the mathematical sequence found universally in nature.
Briefly; the Fibonacci sequence proceeds 1,2,3,5,8,13,21,34,55,89, 144, etc.. Each number in the sequence is related to the next number by a ratio of .618. Each number in the sequence is related to the previous number by a ratio of 1.618 and alternate numbers in the sequence are related by ratios of .382 and 2.618. If we now shift our focus to our knowledge of Gann’s squaring price and time via geometric angles and the Fibonacci rations and proportion both price and time of a previous market movement we would then be squaring price and time within the Fibonacci sequence in relation to a previous market movement.
This leads me to conclude that this is what Gann was alluding to when he mentioned that “…natural law was the basis of market movements” and that “Everything in existence is based on exact proportion and perfect relationship” and finally that “…mathematical principles of the highest order lie at the foundation of all things.”