Trading Articles
Mean Reversion And The S&P 500 By Stephen Beatson
It is generally believed that markets tend to mean-revert. But this is true for some markets more than others. Here’s an in-depth look at how the S&P 500 responds to mean reversion. Mean reversion is not a universal phenomenon; some markets have a tendency toward mean reversion, while others don’t. This has led a number of analysts and traders to look upon mean reversion with some degree of suspicion. If mean reversion has a solid statistical foundation, should it not be applicable to all markets all the time?
Different Strokes
The simple truth is that some markets respond well to mean-reversion strategies, and others don’t. There are several possible explanations for this, including what factors drive the instrument’s price (macro economics, earnings, news, and so on); the number of market participants; the ability to take short positions; the volumes involved; and the average volatility of the instrument in question.
It is generally believed that commodity time series respond better to continuation-type systems (trend-following, breakout, and so on) than to mean-reversion systems. The same applies to currency pairs, which are understood to exhibit long- and short-term trending tendencies. The US stock market daily time series, on the other hand, has consistently demonstrated a strong propensity toward mean reversion. In this article, I will try to determine whether this has always been the case. The focus here will be on long-side mean reversion, that is, on a security’s price’s tendency to move upward after a short-term decline.
I looked at the S&P 500 index from 1970–2013 and applied the following strategy:
- Buy on the close if the index closes at a 10-day low
- Sell on the close 10 days later
- $100,000 per trade, no allowance for commissions or slippage
Figure 1 shows the resulting equity curve. During the 1970–2013 period, the strategy’s win rate was 60.52% and the profit factor (total profits/total losses) was 1.71. This indicates that when the index hit a 10-day low, a trader with a long position was generally better off holding his position and exiting 10 days later.
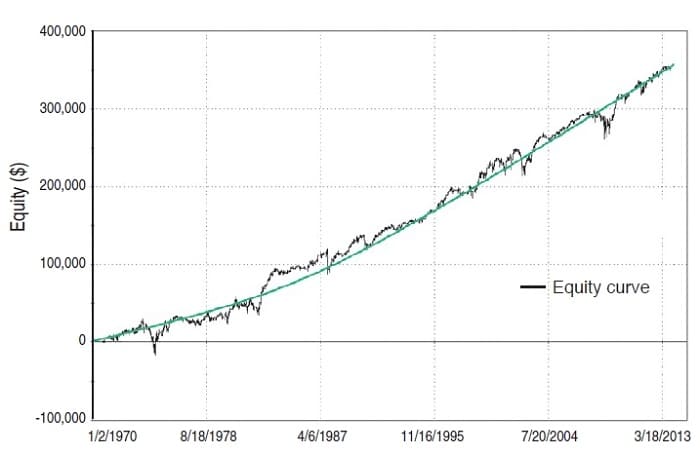
The equity curve’s regular upward slope is quite remarkable. Of course, some of this tendency must be assigned to directional bias — after all, the S&P 500 went up in value almost 20 fold over the period, so you would expect the equity curve of this long-only strategy to display a positive edge. However, the up-ward slope is also stubbornly present throughout the past two decades (1994–2013) that saw some extreme rises and falls in stock market prices.
During both bull and bear markets, a short-term fall in the S&P 500 is more likely to be followed by a bounce than by a continued drop.
Thus, the data suggests that during both bull and bear markets, a short-term fall in the S&P 500 is more likely to be followed by a bounce than by a continued drop, at least in the first few days that follow. In other words, buying price dips and selling at mean reversion would have been a simple and profitable strategy over the past 50 years. To further understand the nature of this short-term mean-reversion cycle, I used the same strategy but applied a much shorter two-day holding period, as follows:
- Buy on the close if the index closes at a 10-day low
- Sell on the close two days later
- $100,000 per trade, no allowance for commissions or slippage
Suggested Books and Courses About Psychology and Risk Management
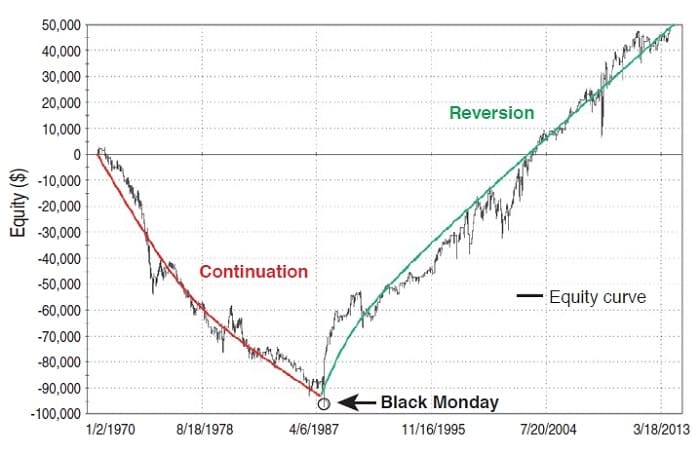
Figure 2 shows the resulting equity curve for the two-day holding period. What you see here is a very different chart. The downward sloping red line indicates that from 1970–1987, the S&P 500 exhibited a strong tendency toward short-term continuation, or follow-through — that is, a 10-day low in the index had a strong tendency to be followed by further selling, at least in the short term (two days). From 1987 to date, however, and quite consistently for the past three decades, the exact opposite appears to have happened: A 10-day low was generally followed by a quick bounce, or reversion. And the inflection point of the equity curve occurred on a specific date, which was October 19, 1987, also known as Black Monday.
Why The Change?
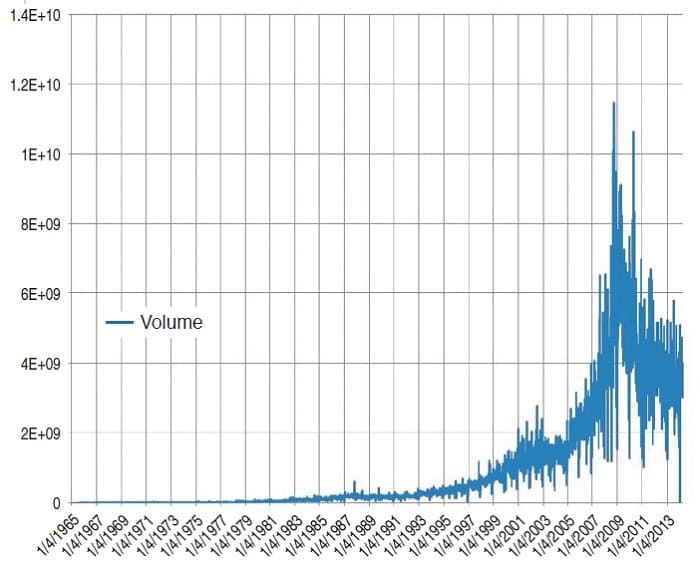
There are arguably four main reasons for this fundamental change in the US stock market’s short-term profile from trending to mean reverting. The first lies in the extraordinary rise in the volume of stock market transactions over the past 50 years, as reflected in Figure 3. Buy & hold investing that was the hallmark of most of the 1900s has made way for active investing, short-term trading, and hedging. Financial products that were intended as vehicles for investment have become tools for speculation. This is the case for just about every financial instrument available in the electronic marketplace. This increased volume has brought about an unprecedented level of liquidity to the marketplace, allowing buyers and sellers to find each other more efficiently, thereby slowing the runaway trains associated with illiquid markets.
A second possible explanation is that until the mid-1980s, stop-loss orders were often executed on the day following the stop being hit. That is, if a stop-loss level was touched on Monday, the broker would execute the sale at the open on Tuesday morning. These sell orders would serve to compound the downward effect, resulting in more stops being hit, and more sell orders being generated on Wednesday morning. The downward spiral would continue until value investors stepped in and confidence was restored. The big change occurred in the mid-1980s with the advent of automated systems that allowed stop-losses to be executed instantly when hit. The multiday price erosion process I described was suddenly compressed, occurring intraday instead of interday. That meant that price stability could be reached before the end of the trading session, allowing opportunistic buyers to step in the following morning, pushing prices back up toward the mean.
The third likely explanation for the US stock market’s short-term mean-reverting tendency is the pervasiveness of short selling. Short selling, in its many forms, has been around for a long time and was certainly very much alive in the 1960s and 1970s. But it was only in the 1980s that shorting on electronic platforms became widely available. This rise in the collective power of the shorts has exacerbated the short-rally effect, which is one of the main ingredients of mean reversion. Essentially, when an instrument’s price is falling, short sellers must buy to cover and take their profits. This buying interest drives prices back up toward the mean. So the greater the short interest, the stronger is the pressure for falling prices to revert back upward.
Finally, we must also consider the advent of strategy-driven automated trading systems and high-frequency traders (HFTs). These have, ironically, brought considerable short-term rationality to the marketplace. Trading systems designed to recognize panic selling step in to oversold situations and buy into market overreactions. This serves to discourage follow-through and favors mean reversion.
Stay The Course
We have seen that the S&P 500 index has exhibited short-term long-side mean reversion for at least the past half century. What’s more, this tendency has been prevalent in bullish and bearish periods. We have also seen what appears to be a quickening in the way the market responds to falling prices. Reversion cycles that in the 1970s and 1980s took several days now occur within a much shorter time frame. Traders recognizing this phenomenon should be able to profit by using mean-reversion strategies that exploit this edge.
Stephen Beatson is an investment consultant based in Paris, France and is founder of the educational site TheMechanicalTrader.com.