Trading Articles
Looking At The Market With Auction Market Analysis By Tom Alexander
Here’s a look at the volatile periods in the broader markets going back to 1928. How do they compare to the 2008–09 market? Check it out with Market Profile. First, what exactly is Market Profile? It is a charting format that displays a horizontal view as well as a vertical one of market development. Initially the brainchild of Peter Steidlmayer and his work of the early to mid-1980s, it is a methodological concept that continues to evolve to this day. Basically, it “explains” the organizational activity of how an auction market works and develops.
The Auction Market
In 1993, Donald Jones published the book Value Based Power Trading, which presents a statistically rigorous model that expands the original profile concept. In that book Jones based his work and his ongoing research under the umbrella of what he refers to as auction market value theory (Amtv). Amtv posits that in an auction market, a given market unit (the same development process occurs regardless of the degree of time involved, so a unit can be a day or several days, weeks, months, or even years) is driven by a search for value.
Value is ultimately determined by the market participants themselves — the buyers and sellers. The buying and selling conducted by the market participants in a given market auction creates activity in the auction range (a profile “unit”). There is a different amount of activity within the range depending on the relative perception of value, or the lack thereof, by the market participants. Traders will spend the most time and conduct the greatest amount of business at prices considered by both parties to be fair. The least amount of trading between buyers and sellers will occur at prices that are unfair for either the buyer or seller.
When value can be determined, the market will remain in balance and trade in a range. It will be attracted to the area of the range that contains the highest volume, which is logical because that is the area of fairest value to both buyer and seller. When the perception of value changes, the market reaches a state of imbalance and it will trend until a new range is established and the process repeats itself.
The Significance Of Value
This simple process has profound implications for the trader, which we will delve into later. For now, what does this tell us about the historic worldwide stock market freefall that began in earnest in August 2008 and carried into early 2009? How many times during that severe decline did you hear a financial reporter or analyst discuss the reason that so many companies and the market itself have such distressed prices as being that value could not be determined? The assets on the books of many financial institutions could not be valued. In turn, the companies themselves could not be valued. This set off a tsunami of uncertainty about what value might be for any financial asset.
Worldwide stock markets reacted to this uncertainty regarding value by doing what they are designed to do: probe for value. A market in search of value will trade higher until it runs out of buyers (the high prices become unfair to buyers), or it will trade lower until it runs out of sellers (the low prices eventually become unfair to sellers). Worldwide stock markets found enough willing sellers that it kept trading lower and lower until finally hitting a low near 667 in the S&P and 6500 in the Dow Jones Industrial Average (DjiA).
Auction market principles explain why value is value at a given time and price level by identifying where, how much, and how often the buyer and seller are buying and selling. This is a determination of value by the actions of market participants themselves. Market pundits may extol the incredible value of a stock, or stock market at a given price level, but if the buyers aren’t buying it (if you’ll pardon the saying), then prices are not going higher. Likewise, the market may appear ridiculously overvalued through the lens of traditional financial metrics, but if the participants don’t agree, the market will stay near the same level or trade higher.
The Volatile Market
Beginning in the summer of 2008, we saw a level of uncertainty not seen since at least the Great Depression. The very financial structure of the United States began to change. The political and social landscape was volatile and certainly changing. How could the stock market possibly know what value was? The political, social, and financial metrics of value changed, but the base concept as determined by the buyer and seller did not. The precepts of Amvt explain the market behavior of the severe decline as well as the incredible rally that followed. We are seeing a market in search of value. A new equilibrium will eventually be established and the volatility will subside and smaller-degree auctions will form. This will provide traders with ample opportunity.
Suggested Books and Courses About Investment
A Look At The Past
How does the present period of volatility and uncertainty compare with others, and is it different this time? Let’s look at several periods of turmoil through the lens of Amvt:
- Djia July 1928–July 1930: This period includes the runup into the final high subsequent to the 1929 October stock market crash (Figure 1).
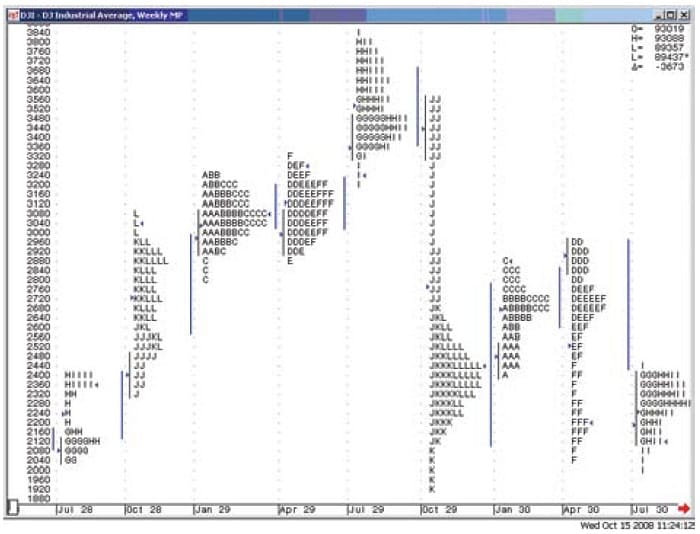
- July 1929–September 1931: This period includes the October stock market crash in 1929 and subsequent several quarters (Figure 2).
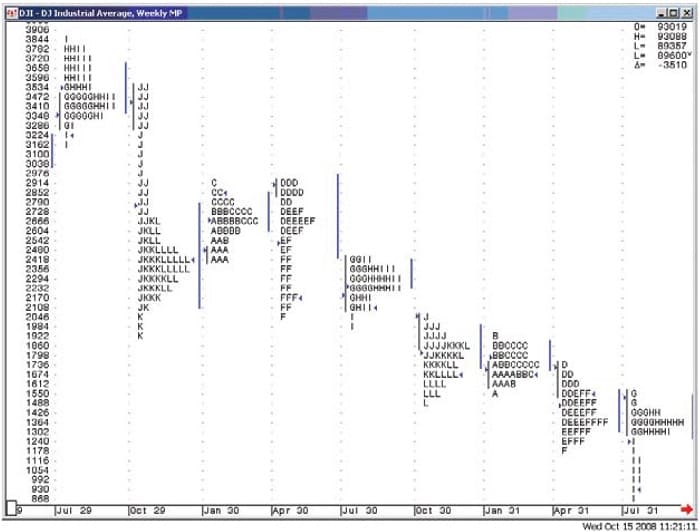
- October 1931–October 1933: This is the view at the ultimate lows of the stock market that occurred at the same time as the nadir of the Great Depression (Figure 3). Incidentally, if you look closely at the price scale of the DjiA at the low on the graph, it reads “396.” That is 39.60 as in 39 and change. It represented more than a 90% drop from the high of 1929.
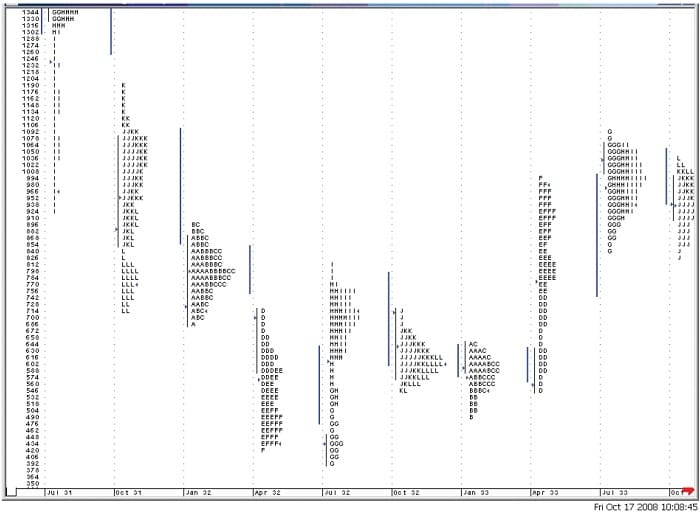
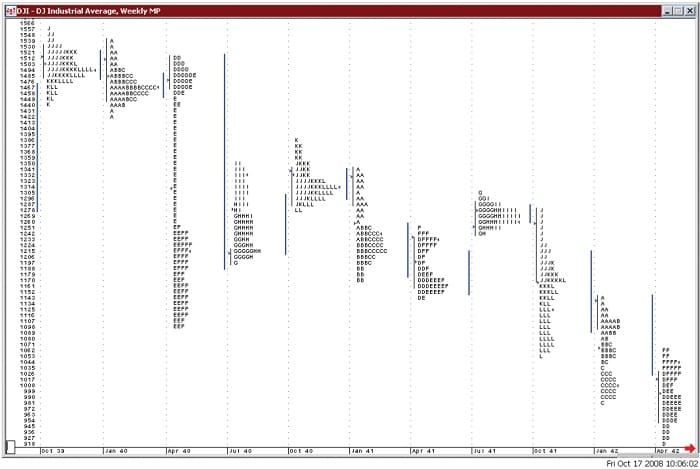
- October 1939–January 1941: This period included the bombing of Pearl Harbor and the beginning of US involvement in WWII (Figure 4).
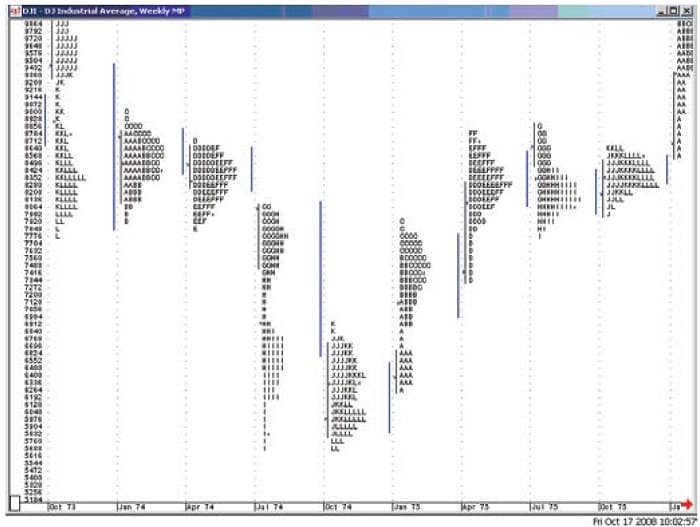
- October 1973–January 1976: This period includes the severe economic recession of the 1970s and the low in the stock market of that period (Figure 5).
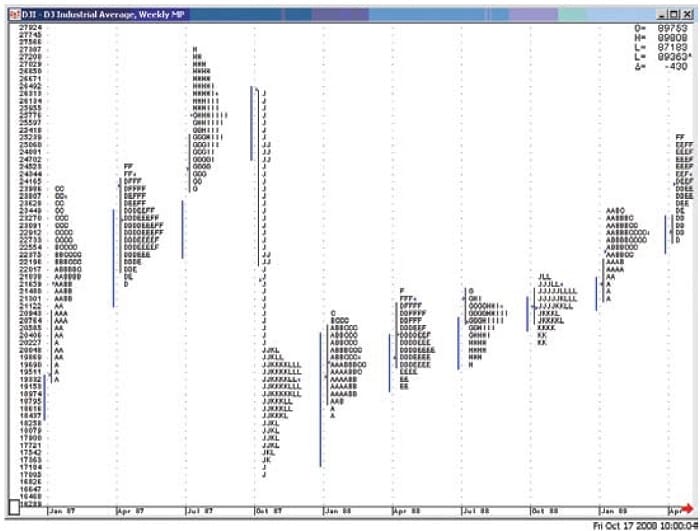
- January 1987–April 1989: This period includes the runup into the summer highs in 1987, the subsequent crash in October, and the following several quarters into April 1989 (Figure 6).
We can clearly see all time frames in all periods going back into the 1920s exhibit the identical look. The same process of auction market principles were in force in the 1920s and 1930s as they are today.
A Look At The Present
Now, let’s look at the Russell 2000 during the rally into the high in 2007 through recent trading.
Russell Yearly Profile Units 2004–09: The Russell 2000 has an eerily similar look from the high in 2007 to the low in January 2009 (Figure 7), to the period of the late 1920s to early 1930s. The point is not to predict or forecast a similar market going forward, but to display the consistency of the shape of the graph that is a depiction of the auction process.

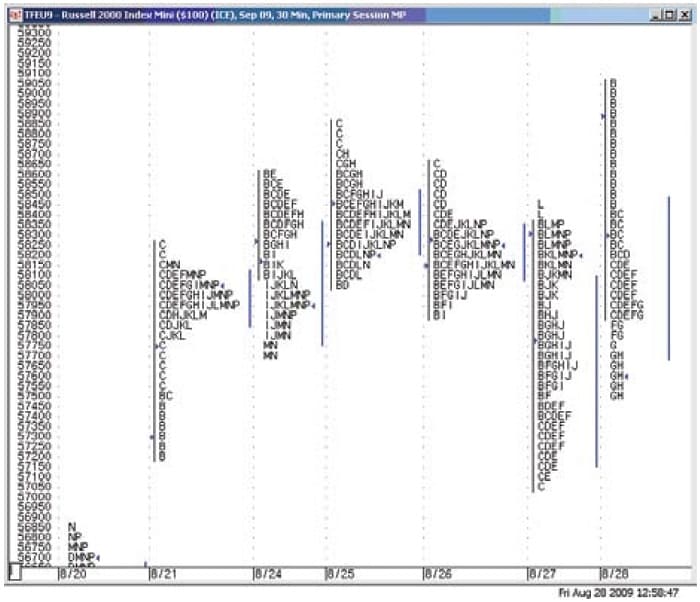
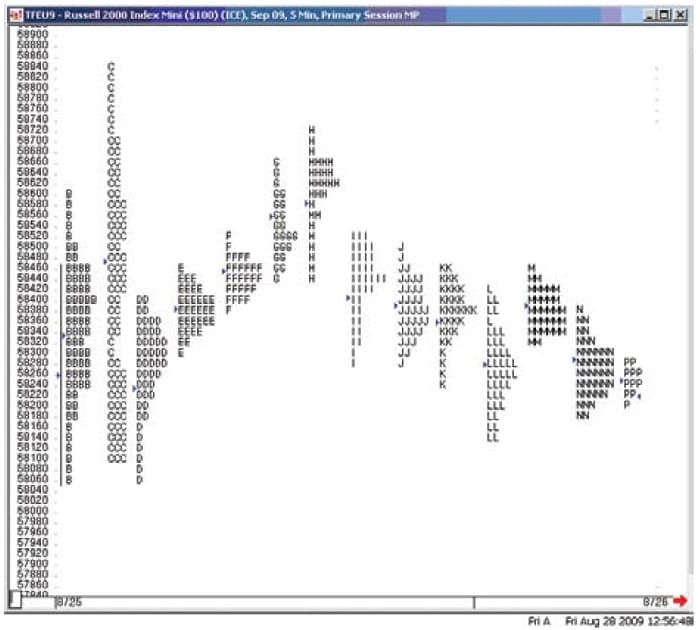
It is not the profile graph that is so special; rather, it is an understanding of the auction process. It is a thorough comprehension of the auction process that enables us to construct any number of valid trading models. There is not a more robust, consistent, or objective approach to market analysis than applying the techniques of auction market analysis to any freely traded market, in any time frame. The Tprocesses of development of an auction market are the same regardless of time frame; they are fractal. This enables the analyst or trader to be consistent whether the time frame is a five-minute intraday chart or a weekly chart. Compare the form of the year-long profile units with the very short-term one-day profile units in Figure 8 and 30-minute profile units in Figure 9.
Fair Value
Analyzing a market through the lens of auction market principles is effective, consistent, and objective regardless of exogenous events because it depends on the market itself to determine value — that is, when value can be determined, what is not value can be determined. Price away from value offers opportunity. I hope that this overview of an increasingly popular form of analysis inspires you to further explore the subject.
Tom Alexander has 24 years of trading experience and is the president of Alexander Trading LLc, a trading research and education firm serving both institutional and retail investors and traders. He also is the comanager of a long/short equity hedge fund.