Trading Articles
Kondratieff Wave Comeback By Koos Van Der Merwe
Elliottician Robert Prechter, known for having predicted the stock market crash of 1987, has said in recent interviews that the sharp rebound in equities from 12-year lows hit in March 2009 has been only a near-time rally within a longer-term bear market. “The average investor who is not a trader should remain in the safest possible cash equivalents,” he said in his classic Elliott Wave Principle, cowritten with A.J. Frost. I have always had a great respect for Prechter. Elliott Wave Principle was my tutor in Elliott wave theory, and when I was a South African resident, years ago, as a subscriber to his newsletter, I would often write him and ask for a further explanation of his wave count, which he always provided, mailed back to me, handwritten on a copy of his newsletter.
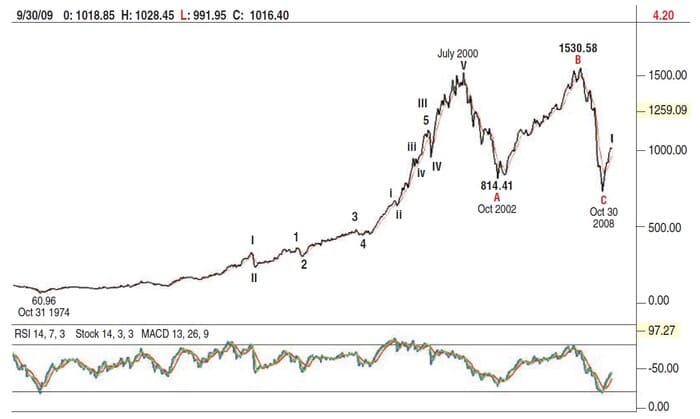
These days, however, I lean more toward Kondratieff theory. The reason for this can be provided with a look at the monthly chart of the Standard & Poor’s 500 (Figure 1). Figure 1 suggests that the S&P 500 is currently in a Wave I up. This is confirmed by the relative strength index (RSI). The chart shows that the last time the RSI gave a buy signal was in October 1974, which was the start of a bull trend that lasted 26 years. Now, we all know that a Wave 1 up is followed by a Wave 2 down, which can be either a simple or complicated wave. By this I mean a quick, fast retracement, or a long, drawn-out retracement. In Elliott Wave Principle, Frost and Prechter wrote: “Second waves often retrace so much of wave one that most of the profits gained up to that time are eroded away by the time it ends.”
Yes, there is a lot of negativity to come, and you can take profits and “remain in the safest possible cash equivalents” as Robert Prechter suggests, but you should not forget that the “bear” in a wave 2 is a correction in a major bull trend. So why am I comparing Kondratieff to Prechter and the Elliott wave theory? Kondratieff waves predict future economic cycles, with dates for turning points. They were designed to predict the start and end of economic expansion, recession, and depression, not the movement of the stock market or indexes like the S&P 500, although the two are related. Elliott wave theory predicts turning points of the stock market indexes and even then a wave count can change as the future unfolds. As I have often written, Elliott waves are only a signpost in the wilderness. The K-wave, on the other hand, is solid economic theory.
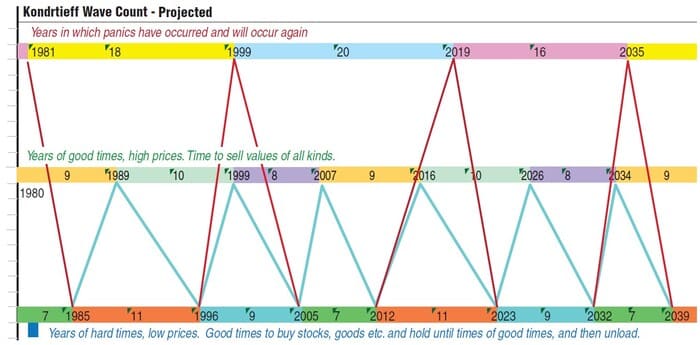
First of all, study Figure 2 and note the projected turning point dates, then study Figure 3, a K-chart with the S&P 500 super-imposed, and see what that tells us. Figure 3 shows the K-wave chart from 1989 to 2015 with the S&P 500 superimposed. The chart suggests that the index should have topped out in 1999. The index as shown on the chart in fact peaked in March 2000, one and a quarter years later. Bear markets move faster than bull markets (as Elliott Wave Principle tells us), which tend to languish as most investors buy at the top. We could therefore expect the bear market that followed to fall fast and furiously (with investors selling at the bottom) and it did, with the index bottoming in October 2002 rather than the K-wave forecast of 2005, two and a half years too early.
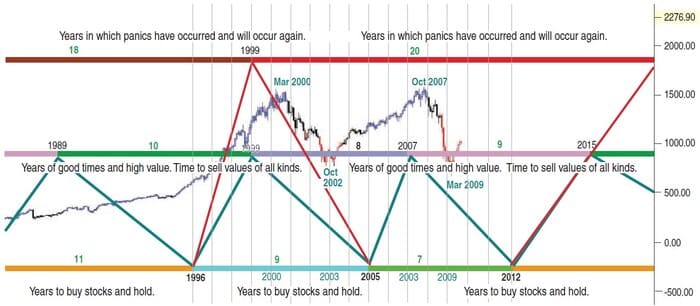
These figures then give us a guide to anticipate future moves in the S&P 500. The K-wave forecasts a top in 2007. With the bull market delay previously at one and a quarter years, we could therefore expect the S&P 500 to top sometime in 2008. As shown, the index peaked October to December 2007. The bear market bottom should by all accounts be two and a half years earlier than forecast — that is, sometime in 2009. The S&P 500 appears to have bottomed in March 2009. This means that you could expect a bull market to top some time in 2019 or even 2020.
Suggested Books and Courses About Elliott Waves Method
What would make the market react quicker in today’s economy than Kondratieff originally forecast? First of all, as mentioned earlier, his forecast was designed to predict economic expansion, recession, and depression, and not the movement of the stock market. The second, and here I can only guess, would be electronic market trading, where orders are filled far quicker than when the huge stock market exchanges slowly grind their way through the buying and selling of stocks. Hedge funds in today’s world, something that Kondratieff could not have foreseen, trade large blocks of shares electronically, avoiding the relatively high fees charged by the big exchanges and also receiving immediate fills. These are typically the most liquid stocks listed on the big exchanges.
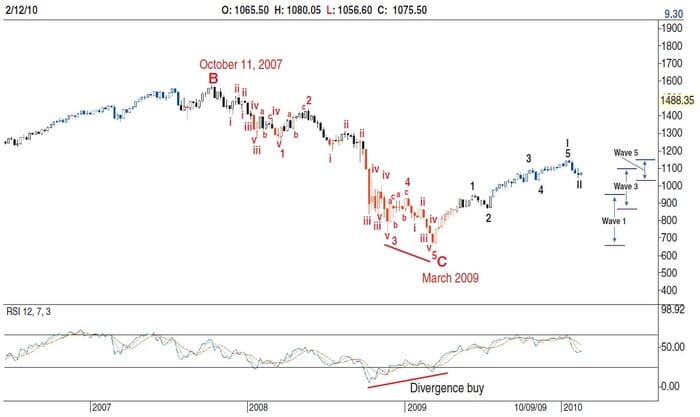
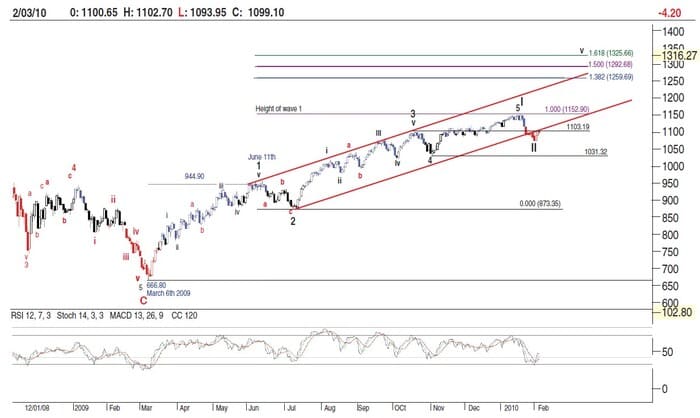
Figure 4 suggests that the index has completed wave 5 of Wave I and is currently busy with Wave II. Whether this wave will be a simple or complicated correction, the RSI does suggest the former. In Elliott Wave Principles, Frost and Prechter write, “Second waves often retrace so much of wave one that most of the profit gained up to that point is eroded away…”
What is obvious on the chart is that wave 3 of Wave I is less than wave 1. This suggests that wave 5 will be less than wave 3 and a look at Figure 5 shows that this is exactly what happened. This therefore suggests that Wave II will be flat and will finish somewhere between 1103 and 1031 as shown on the chart, the fourth wave of lesser degree, as Prechter wrote to me in the 1980s when a similar pattern formed on the Johannesburg Stock Exchange. The start of Wave III in February 2010 will be two years earlier than the K-wave suggests. Two things could therefore occur. Wave II could be long and drawn out, or wave 2 of Wave III could be a strong drawn-out correction.
We all know a wave 2 retracement can be a 72–100% correction. The bears will therefore jump in exultation, rejoicing in their accuracy, while the bulls will see the correction as a further buying opportunity. The bulls will have the buy signal of a rising RSI on the monthly chart as proof of their conviction. Looking at the K-wave of Figure 3 once again, if all this were to happen — namely a market crash and the start of Wave II in January 2010 — then we could expect Wave II to bottom sometime in 2010, when Washington, DC–area economists are suggesting as the year that marks the end of the current recession. This is because the chart shows that the index previously turned about two years before the K-wave turning point. Do note, however, that Kondratieff is only calling for the end of the recession in 2012, but do not forget, the stock market usually anticipates and moves ahead of the economy.
Nikolai Kondratieff was a remarkable wave theorist. In today’s modern world, however, allowances must be made. I often wonder to what extent he would change his charts if he had lived in today’s fast world, or if he would change them at all.
Koos van der Merwe has been a technician since 1969, having worked as a futures trader and finally as a technical analyst with a stock brokerage firm in Johannesburg, South Africa.