Trading Articles
Intraday Short-Term Trading Tactics By Ron Walker
Enter and exit trades the right way based on familiar chart patterns. Swing trading prospects occur when price patterns form. Even though traders might be familiar with many chart patterns, they may not know how to enter and exit trades correctly based on those price patterns. Our purpose here is to discover short-term trading strategies that will help fine-tune entry and exit points while properly assessing stops. I’ll illustrate some attractive setups using the hourly chart of the ProShares UltraShort for the Standard & Poor’s 500 (SDS).
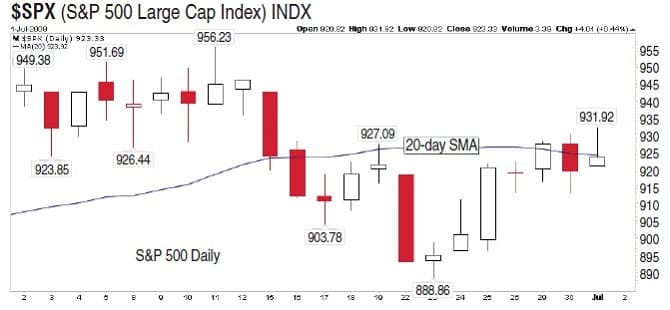
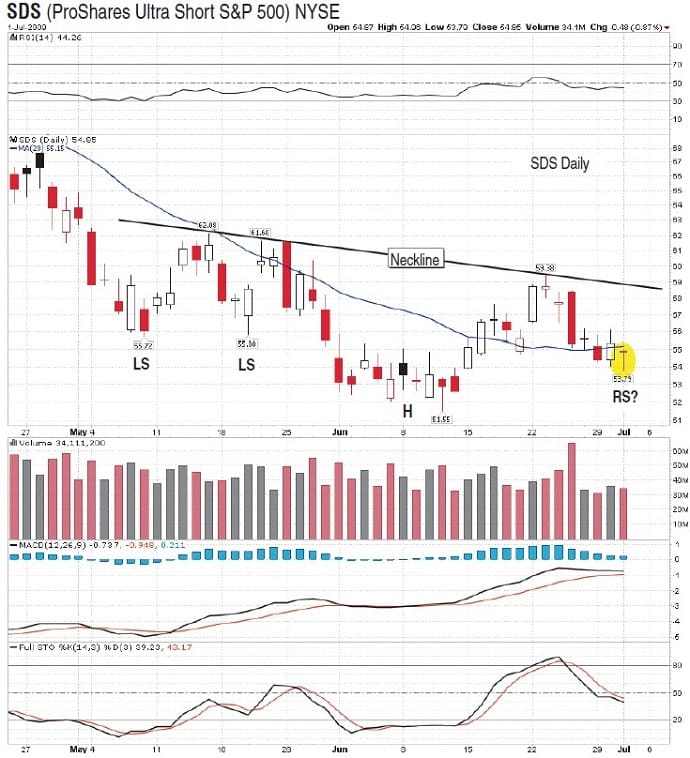
The ProShares Ultra Short for the S&P 500 (SDS) is one way to short the S&P 500 using leverage. It moves twice the inverse of the S&P 500. If you wanted to short the S&P 500, you would go long SDS. Ideally, you want to be long SDS (short the S&P 500) when the S&P 500 is below its 20-day simple moving average in the daily time frame, as is in Figure 1. Doing so will increase your odds for a successful trade.
STEPS TO TAKE BEFORE TRADING
So let’s review the hourly chart to see what the prospects are before deciding to take a trade. Figure 2 shows that in mid-June the hourly chart of SDS had been in a rising channel for almost two weeks when a bearish descending triangle pattern appeared on June 23. A bearish divergence loomed over the hourly, increasing its negative influence over the descending triangle pattern. The following session, prices gapped lower, collapsing through the triangle as they tested the lower boundary of the rising channel. This move was accompanied by a bearish crossover of the moving average convergence/divergence (MACD) (12, 26, 9).
Prices plunged lower to the previous level of gap support at $56.50, which intersected with the rising trendline offering a twofold layer of support. After this brief correction, prices made their way higher once again to challenge the last minor high just above $59. Unable to move above it, the rally failed, putting in a lower high. Prices quickly retreated, penetrating through the channel. When a stock or exchange traded fund (ETF) makes a lower high and then a lower low, exit the trade, because the uptrend is broken. In this case, the lower low successfully breached both horizontal and rising support with the same candlestick.
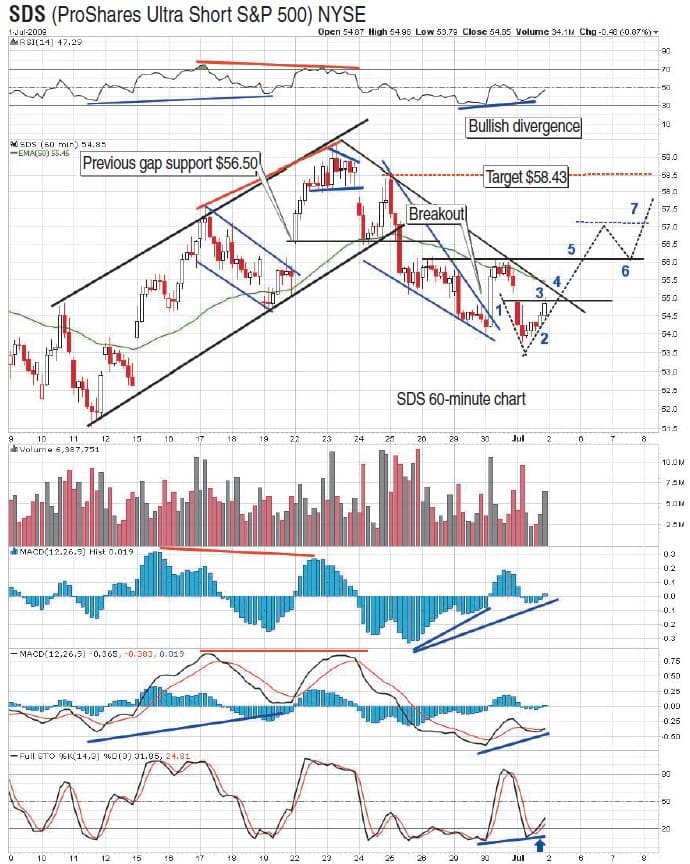
Prices sank lower for several days until June 29, 2009, when a bullish falling wedge appeared. The following day, the pattern broke to the upside after a bullish divergence formed with moving average convergence/divergence (MACD) histogram (12, 26, 9). SDS then shot up and crashed into the last minor high at resistance near $56, resulting in a price reaction. The falling wedge pattern originally formed because of a rapid decline in price, but after the breakout, prices began consolidating sideways.
The breakout and test to resistance brought about another reaction, carrying prices back down, testing the momentum low made in the falling wedge pattern. SDS then made a lower low and formed a bullish divergence seen on the MACD and the relative strength index (RSI)(14). SDS then thrust upward, forming a possible double-bottom pattern. Savvy swing traders latched on at the pivot reversal (the point when prices reverse, marking the second bottom). If a double-bottom pattern does in fact manifest, the measurement would take SDS slightly above $58, where the first lower high was put in. The pattern measures $2.32, and adding that to the pivot point of $56.11, the pattern’s target is $58.43. Appropriately, that is right where resistance resides, corresponding with where the first lower high appeared.
Suggested Books and Courses About Trading With Indicators


LOWER RISK AND INCREASE RETURNS
So let’s review some trading tactics that offer the most attractive and low-risk methods. Let’s begin with the premise that prices are undergoing an authentic reversal. The first buy signal came just before prices were breaking out of the falling wedge pattern. Note that a bullish divergence formed with the MACD histogram, and shortly after that the Macd got a bullish cross (see entry point 1). A trader could have entered before the breakout using the histogram or waited until the breakout, watching for confirmation by a bullish MACD cross. However, he/she might have been stopped out on this entry point when prices moved to a lower low the following session, falling $0.26 below the low made in the falling wedge. A 1% stop below the last minor low of $54.05 gives a very liberal stop of $0.54. A more conservative stop would be placed $0.10 to $0.15 below $54.05.
The next opportunity came as the second bottom formed. Again, a trader could have gone long SDS once the second bottom concluded by testing the first initial low at the pivot reversal (see entry point 2). This was marked by a sharp reversal as prices rose to gap resistance. Now take a closer look at the 60-minute chart in Figure 3. Note that it was a bullish harami two-bar candle pattern (highlighted in yellow) that brought about the pivot reversal. The second candle marked the pivot reversal. Further, not only did the third candle confirm the harami pattern, it completed a three inside up pattern. This pivot entry point was confirmed by a bullish cross on the stochastic.
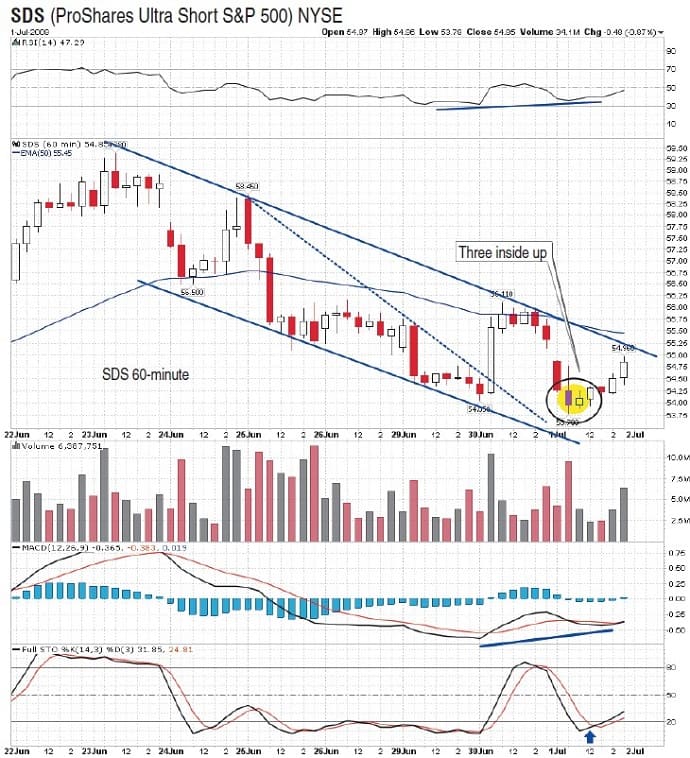
This trade requires placing a stop just beneath the last minor low at $53.79. This entry point should pique the interest of swing traders because it offers one part risk to four parts reward, meaning that if a trader were to go long on SDS near $54.25 (the pivot reversal), the downside risk would be less than a point with a proper stop, whereas the upside potential would offer a four-point gain with the objective target at $58.43. However, this trade would require extreme discipline and be quickly abandoned should the trade decisively slip below the $53.79 minor low.
Back in Figure 2, a practical trade can be taken as prices move above gap resistance as the bullish MACD divergence runs its course (see entry point 3). Or how about when SDS breaks above the falling price channel near $55.25 (see entry point 4)? A swing trader could also wait and buy strength, looking for the pattern to flex its muscle by breaking above the confirmation line of the double-bottom pattern, which would get a trader long once prices plowed through $56.11 (see entry point 5).
After the breakout, a trade could also be taken on the first initial pullback to support (near the confirmation line of the pattern; see entry point 6 in Figure 2). Often after an explosive breakout, prices will drift back to support on light volume and retest the breakout. This retest could offer you a good entry point, giving some reassurance that the breakout was legitimate. Again, at the retest you should seek the pivot reversal point and place your stop below it, anticipating that the advance is ready to resume. As the advance resumes, a trailing stop can be used, raising it just underneath each successive higher low made in the price progression.
Again, all these trades require that you watch for reversal signs, using indicators such as the Macd, MACD histogram, stochastic, RSI, and candlestick reversal patterns in conjunction with support and resistance levels. If the breakout is in question, you could wait until after the retest and buy just as prices are rising above the momentum high made right after the breakout (see entry point 7, Figure 2). This strategy is predicated on buying strength rather than weakness, but it presents more risk.
WHEN SHOULD YOU EXIT?
Selling can get tricky. But with this setup the minimum objective target is $58.43, which is in agreement with the next level of horizontal resistance, should prices nudge above the resistance zone between $56.11 and $56.50. This area has longer-term ramifications of resistance because it is the neckline of the larger two-month inverse head & shoulders pattern (see Figure 4). Note the neckline sloping down toward $58. If the pattern is balanced with the left side, then a second right shoulder will form. In addition, it is interesting that the daily chart of the S&P 500 got a bearish shooting star candlestick. In contrast, SDS printed a bullish dragonfly doji with the cross forming in the upper part of the doji.
Moving averages can also offer a great opportunity to find an entry point. Prices rising on the hourly charts have a tendency to find support at or near the 50-period exponential moving average (EMA). As I write this, prices aren’t rising above it, so this strategy cannot be applied at this point.
FINDING THOSE ENTRY POINTS
So in review, entry points 1 through 7 mark places where a trader could go long with some common-sense stops placed just below each entry point. Tactical entry points are:
- At the breakout of the falling wedge
- The pivot reversal of a potential double-bottom pattern
- At the gap pivot point near $54.90
- At the breakout of the channel near $55.25
- At the breakout of the double bottom pattern at the confirmation line
- After a successful retest of the price pattern
- When prices exceed the peak made after the breakout.
Ron Walker is an active trader and technician. He operates an education website dedicated to the study of technical analysis. The website offers free market analysis with daily video presentations and commentaries.