Trading Articles
Goodman Wave Theory: Structure, Symmetry, and Wave Analysis
Goodman Wave Theory (‘GWT’ ‘Goodman’) was developed by trader Charles B. Goodman in the 1940s and 1950s. He used it very successfully in commodity futures and equities. GWT is derived from four simple and transparent concepts. In this article I discuss these – The Axiom of 1-2-3, the Propagation Principle, the Intersection Principle and the 3-C Principle. These will also demonstrate how Goodman differs from the more well-known Elliott. Finally, I will show the basic GWT trade setup.
The Axiom of 1-2-3
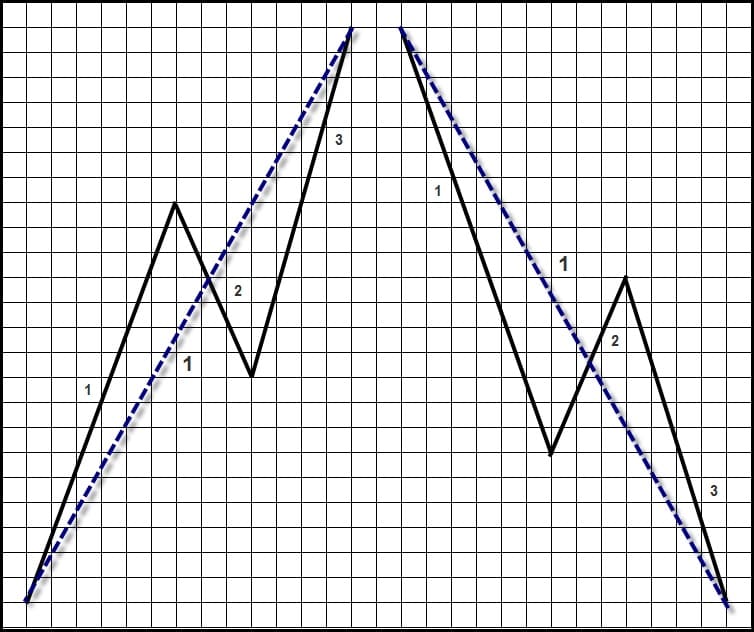
In Goodman Wave Theory everything is a 1-2-3 – a swing in the primary direction (1), a swing in the secondary direction (2) and a second swing in the primary direction (3). The 1-2-3 is the building block of all markets. The Principles and Rules of GWT tell us how these 1-2-3 at multiple price levels combine to form a price chart we see of any given market. Small 1-2-3s are said to propagate into larger 1-2-3s and are said to nest within the larger 1-2-3s.
The Ideal Matrix
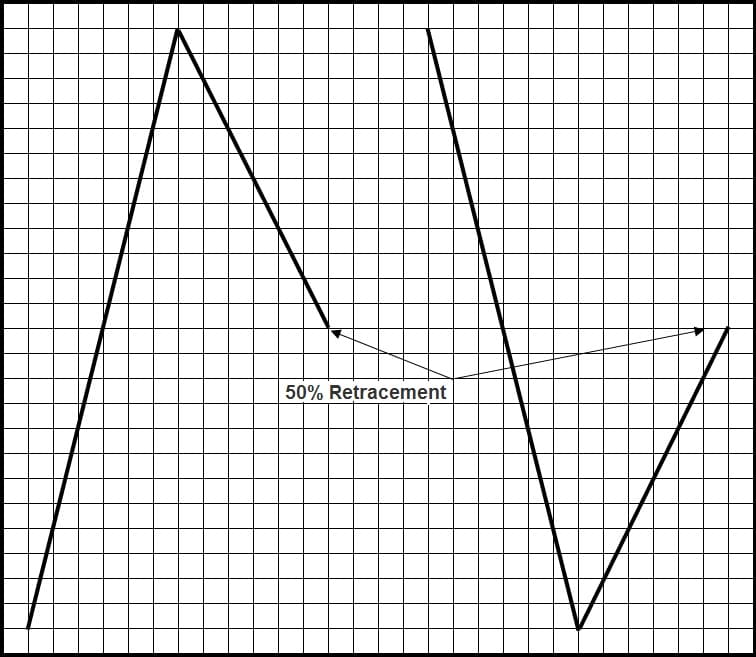
A 1-2-3 is called a matrix. Let’s begin with a look at the Ideal Matrix which is familiar to many traders as the 50% Rule and Measured Move Rule. The 50% Rule states prices will find support or resistance at the 50% retracement of a price swing. The logic is easy enough to understand. At the 50% point all the buyers and sellers in the swing are – in the aggregate – even. Half of the buyers and half of the sellers have profits; half of the buyers and half of the sellers have loses.
Mr. Goodman taught me the importance of being able to detect the underlying logic in any chart formation or indicator tool I studied and contemplated using. The RSI for example, is, after all, a flavor of the slope-intercept equation from high school algebra, y = mx + b. Charlie could draw the RSI on a chart without calculating it and be very accurate. ‘Everything is in the charts,’ he would say.
Much has been written about the 50% retracement. Mr. Goodman cut his trading teeth and spawned GWT from Burton Pugh’s Secrets of Wheat Trading series. Trident by Charles Lindsay and The Trading Rule That Can Make You Rich by Edward Dobson are other works covering this old but very sound idea. In GWT a ‘swing’ is a price trend without more than a 25% retracement.
When these buyers and sellers unwind, it will create a measured move with the third swing, at which price point, ceteris paribus, either all of the buyers have profits and all of the sellers have losses (up swing) or all of the sellers have profits and all of the buyers have losses (down swing).
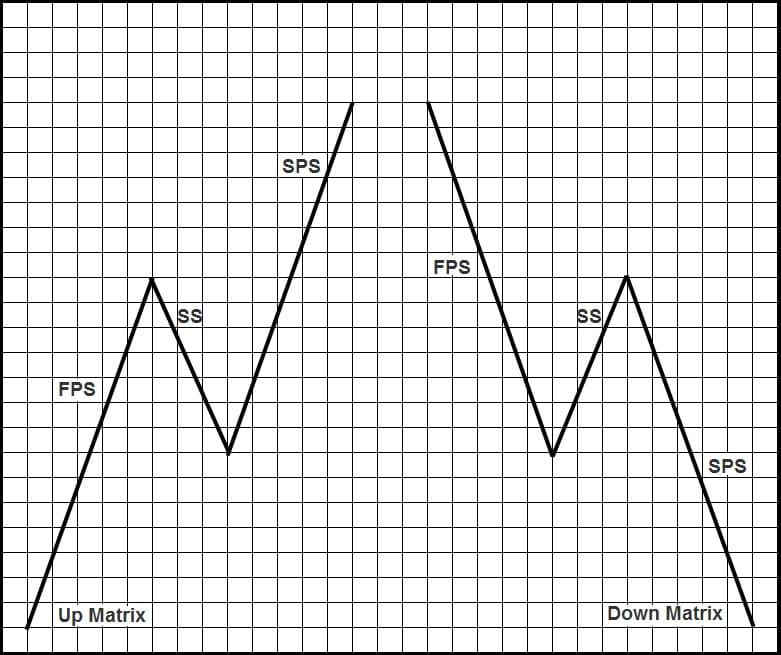
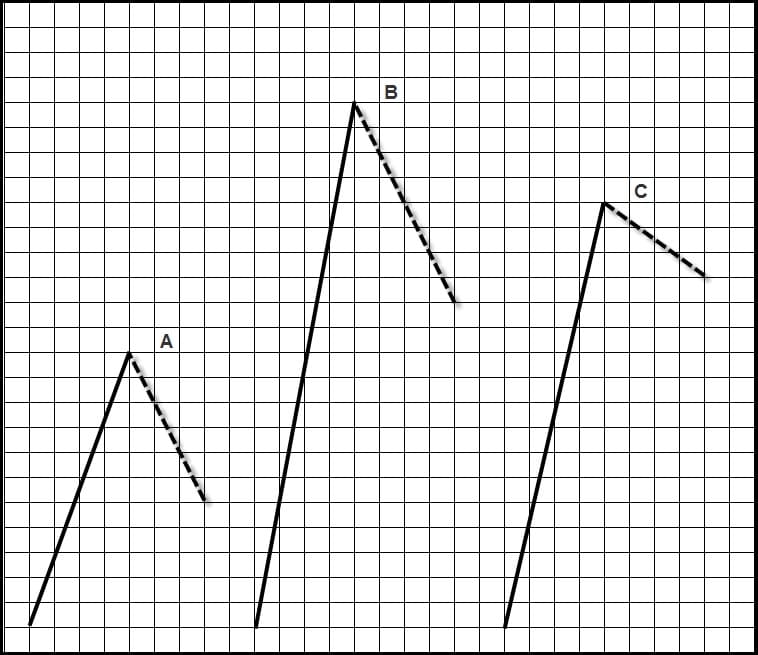
A matrix is composed of three swings, two Primary (First Primary Swing – FPS) and Second Primary Swing – SPS) and one Secondary (Secondary Swing –SS). A matrix need not conform to the ideal measurements as long as the SS is a swing that represents at least 25% of the value of the FPS. The beginning price of any swing or matrix is the Beginning Point, BP. The ending price of any swing or matrix is the Ending Point, EP. The 50% measurement of any swing or matrix is the Tipping Point, TP.
The Propagation Principle
This is the most important principle in Goodman Wave Theory. Just looking at charts as propagations of 1-2-3s will give you a fresh perspective. Matrices are said to propagate. Once a 1-2-3 forms it becomes a ‘1’ for a larger 1-2-3.
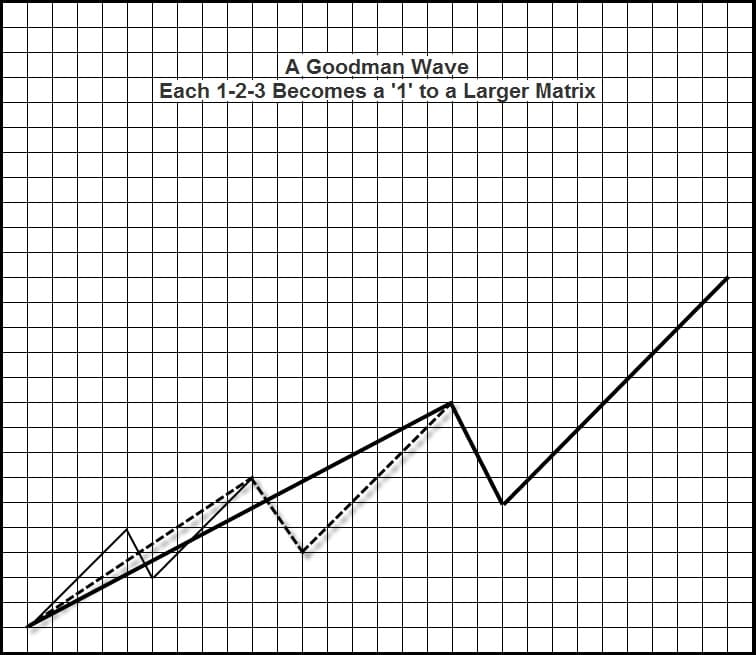
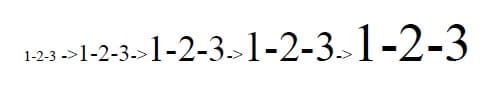
In GWT a propagated matrix is a Goodman Wave.
Advanced Books and Courses on Elliott Wave Theory


Goodman Versus Elliott
All wave theories of course share common ideas. But between Goodman and Elliott there are three important differences. The first of these is GWT sees a 1-2-3 as the primary building block whereas Elliott sees a 1-2-3-4-5 as primary. This is not simply syntax. Since matrices propagate there is a critical difference in the ‘4’ swing.
In Elliott the ‘4’ swing is related to the ‘3’ swing. In GSCS the ‘4’ swing is the beginning of a propagation and is related to the entire 1-2-3 matrix. In GWT the ‘4’ swing is called the Return or Return Swing. The End Point (EP) of the previous Secondary Swing is the Return Point. The price area between the Return and Return Point is very strong and often results in a reversal or at least a powerful ‘bounce’ in prices – it is called the Return Zone and is a factor in all three Goodman trade setups.
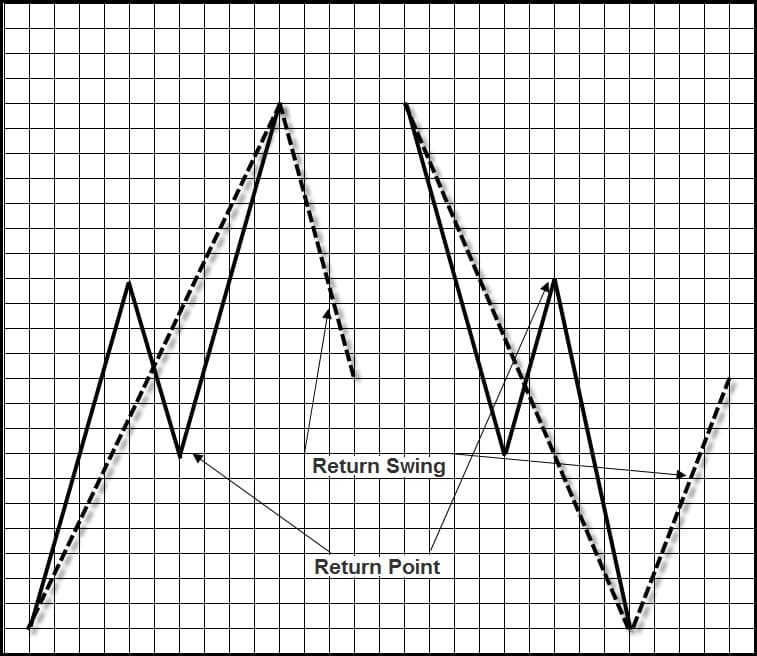
If you have studied Elliott you may have discovered that problems – usually resulting in multiple forecasts – begin with that key ‘4’ swing. The reason for this, according to GWT, is that the ‘4’ is not related to just ‘3’ but to the entire ‘1-2-3’ which has become a ‘1’ in propagation.
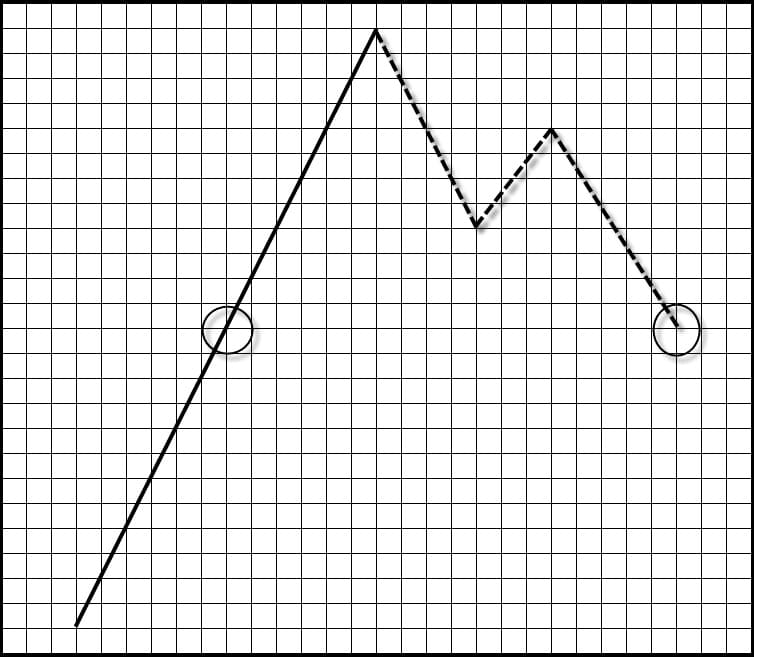
In Goodman Wave Theory an Intersection is a price where the points of two or more matrices or a matrix and a swing meet. The intersection of two swing points is not an intersection. To understand the Intersection Principle consider the 50% point in the 1-2 component in Diagram 2. ‘At the 50% point all the buyers and sellers in the swing are – in the aggregate – even. Half of the buyers and half of the sellers have profits; half of the buyers and half of the sellers have loses.’ The TP is an important equilibrium point. In the standard 50% component of two swings the EP of the secondary swing intersects the TP of the primary swing.
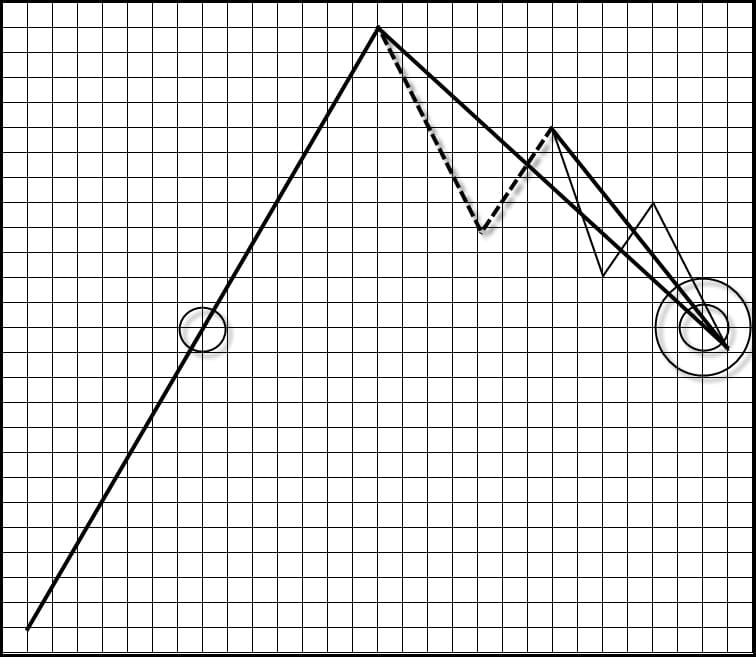
Double and Triple Intersection
While Goodman finds this important it is not considered by itself enough to be tradable. Goodman Wave Theory goes another step: If more swing and/or matrix points meet at the same price, the equilibrium should be even stronger. A double intersection:
A Triple Intersection:
GWT has identified a number of standard intersection forms in price action. These are called ‘templates.’ Within the set of Templates there are even more useful ones which adhere to the Principle of Propagation. These are the Goodman Propagation Templates. I always have a PowerPoint of them open on my desktop to compare with any chart I want to analyze. From my experience nearly 90% of all charts may be reduced a Propagation Template.
This is the second difference between GWT and EWT. All wave theories have some level of indeterminacy – ‘Is it this or is it that?’ Description is nice but it doesn’t put money in the bank. It is prediction we seek as traders. The level of indeterminacy in Elliott is very high. In Goodman, intersections and templates lower the level of indeterminacy by narrowing down the possibilities; getting the trader closer and closer to a bona fide trade candidate.
The 3-C Principle
A third difference between Elliott and the Goodman Swing Count System – the latter provides a built-in counting scheme to make forecasts more accurate and simultaneously providing the trader built-in price targets. The years I have mentored traders on GWT, the 3-C Principle is typically received as the most interesting. I caution however, to become familiar with the first two Principles before working with the 3-C. You cannot do algebra until you know how to add, multiply, subtract and divide. 3-C stands for Compensation, Carryover and Cancellation.
In GWT if prices miss the 50% retracement of the FPS – the EP of the SS – either by going too far or not far enough, that amount will be made up on the next swing at the SPS EP. Prices will be over or under the measured move by that amount. The logic is similar to that of the measured move: any imbalance will need to be compensated at some point.
By simply ‘eyeballing’ a few charts you can see the 3-C in action. If a SS is shorter than the 50% retracement the SPS is often longer in length than the FPS; if the SS is longer than the 50% retracement the SPS is often shorter in length than the FPS. Tracking this natural rhythm, even without doing a 3-C analysis is useful.
In this example the FPS is 12 units. One SS is 2 units short of the primary swing TP and the other SS is 2 units long the primary swing TP. The target value where the matrix cancels will be either 2 units short of 12 (10 units) or 2 units long of 12 (14 units) – as measured from the FPS TP. The ‘over’ or ‘under’ will re-establish buyer-seller equilibrium.
In GWT prices will compensate for missing the 50% retracement. That amount will carry over until it cancels. A cancel counts as an intersection in Goodman Wave Theory. This is the Primary Count. If prices have not cancelled, a Secondary Count is made to the next swing. By offering target price zones GWT further responses to the issue of indeterminacy.
The Basic Goodman Trade Setup
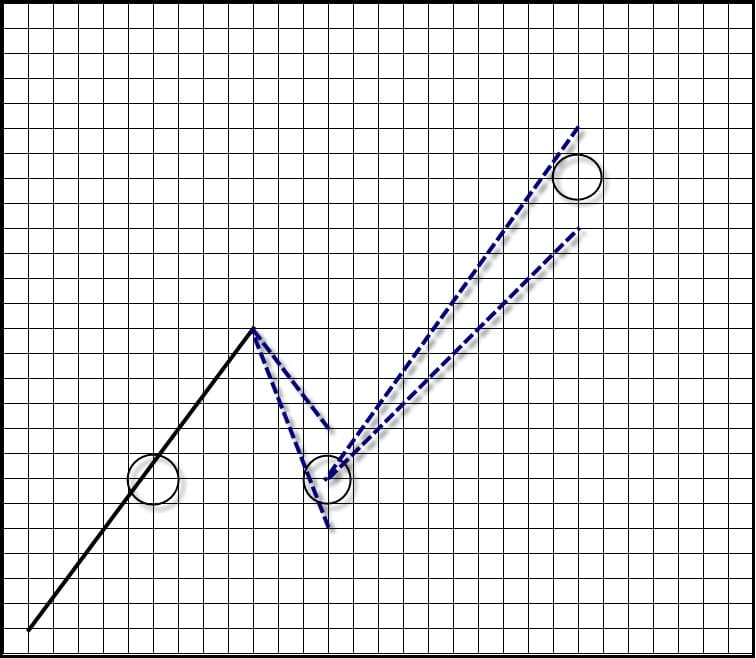
There are three Goodman trade setups – Return, Standard and PTS (Propagation Trade Setup. They all are varieties of the Basic Setup.
- Identify a 1-2-3 matrix
- That 1-2-3 becomes a ‘1’
- Wait for the propagated ‘2’ or Return Swing
- Watch for the propagated ‘2’ to enter the Return Zone and intersect the 1-2-3 near the TP.
- Find an entry point and trade for the propagated ‘3’
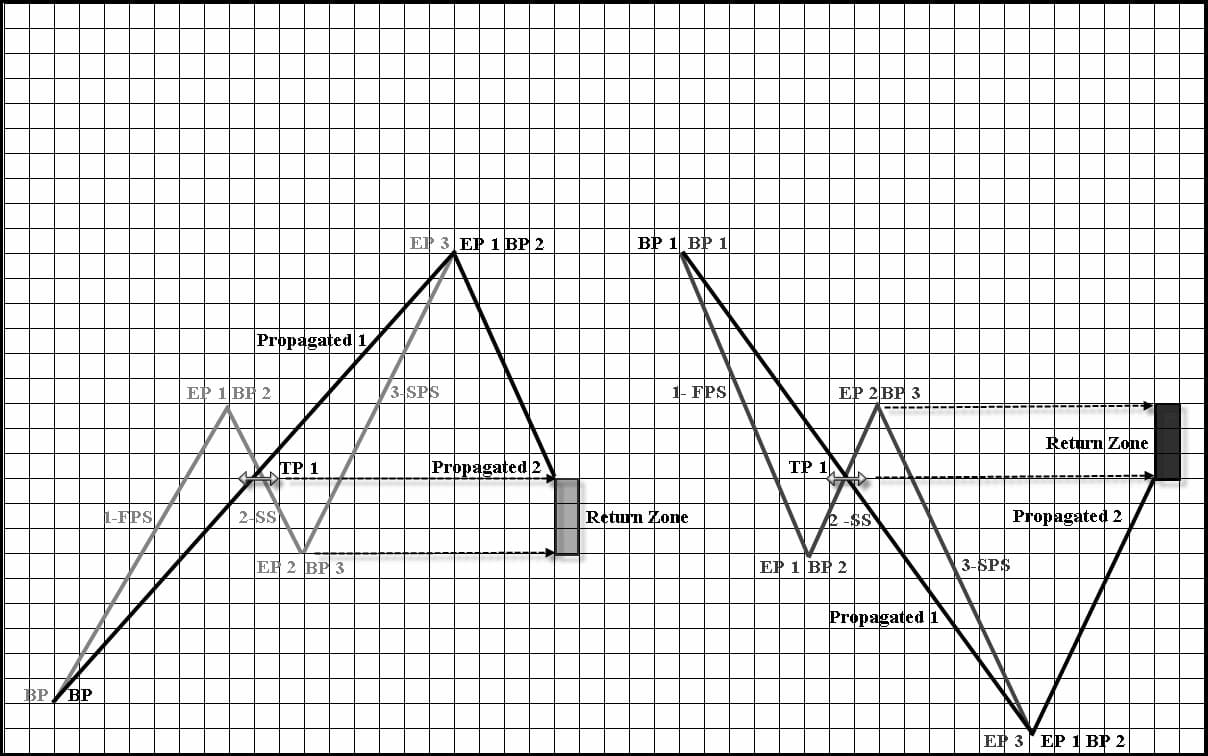
Remember, in GWT the ‘4’ swing is connected to the entire previous 1-2-3 swing. The 1-2-3 becomes a larger ‘1’ and the ‘4’ a propagated ‘2’.
In Goodman the 1-2-3 -> 1-2 is the Setup and the -3 is the trade.
The Basic Setup uses the Axiom of 1-2-3, the Propagation Principle and the Intersection Principle. More accuracy can be derived by applying the 3-C Principle once you have identified a Basic Setup. The Basic Setup is qualified with what are called Overlays in GWT. From the Basic Setup the trader is said to look ‘inward’ and ‘outward’ to find the best trade candidates.
Goodman Wave Theory – Advanced Concepts
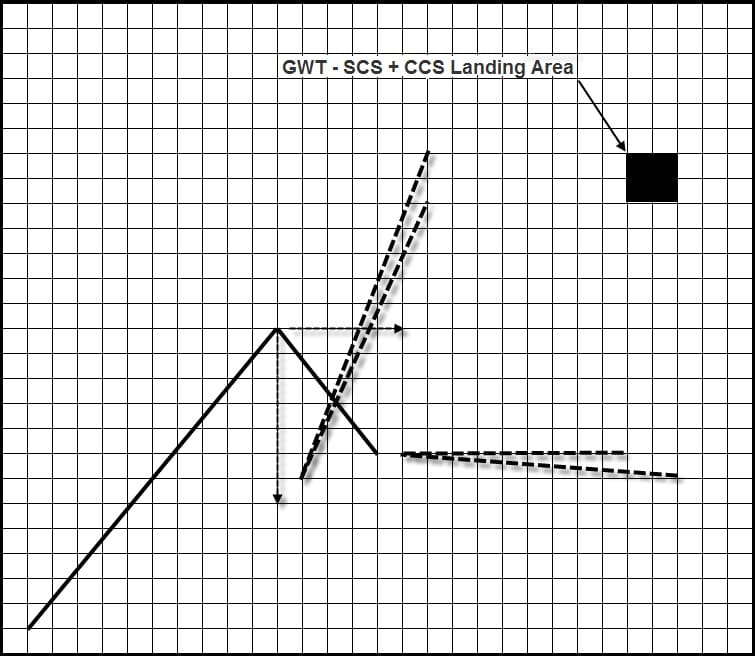
There are a several more GWT principles as well as key concepts such as overlay, dominance, breakaway, Siamese swing and the fascinating Goodman Knot. But perhaps most interesting is the time-based parallel to GWT’s price-based forecasting discussed herein. Mr. Goodman considered GWT comprised of both components – the Price Count (PC) for prices as I have discussed here and the Time Count (TC) for time.
Whereas PC gives vertical price ranges for points and intersections, TC generates horizontal time ranges. Together they form price-time /horizontal-vertical intersections on a chart called landing areas.
Summary
Generally speaking, Goodman Wave analysis results in less-and-less possibilities and higher-and-higher percentage setups whereas Elliott Wave analysis tends to result in more-and-more possibilities. Several of my students have observed that Elliott is more descriptive of charts while Goodman is more predictive of charts. Of course, both have areas of indeterminacy – but in Goodman these are not only less in number but very specific in formation, thereby allowing for quantification and objective study and analysis.
Goodman Wave Theory has one axiom and three main principles: The Axiom of 1-2-3 and Principles of Propagation, Intersection and 3-C. These also differentiate it from Elliott Wave Theory. Propagation is the most important, stating every 1-2-3 becomes a ‘1’ in a larger 1-2-3. The basic Goodman trading setup is to find a 1-2-3 that has propagated into a larger -1-2 where the EP of the propagated ‘2’ intersects the TP of the original 1-2-3 in a Return Zone.
The Goodman trade is for the larger ‘3’ swing. Intersection narrows the possible forecasts and 3-C provides built-in price targets. A novice can begin using Goodman Wave Theory with very little study and an experienced trader can integrate it into his or her trading routine. Goodman Wave Theory, like chess, is a sea in which a gnat may drink and an elephant may bathe.