Trading Articles
Evaluating Forex Trades By Brian Twomey
Will the currency pair you are trading reach your target? Here’s how to determine uptrends, downtrends, or range trades. Many traders evaluate a currency pair and make a trading decision based on their observation of what the indicators say about that pair. In many instances, these indicators are short-term tools and can provide little knowledge of whether that pair will reach its destination or your objective. Analyzing charts in multiple time frames is an excellent approach in order to evaluate pairs, but again the question arises: Will that pair reach its intended destination?
Since markets are so closely aligned together, there are other methods that traders should be aware of to examine an uptrend, downtrend, or range trade. This article will evaluate trading decisions through a multitude of currency pairs using currency cross-rates, dollar-opposite trades, dollar-similarity trades, and the use of other markets such as gold, oil, US Treasury bonds, and US stock markets.
USING THE DOLLAR INDEX
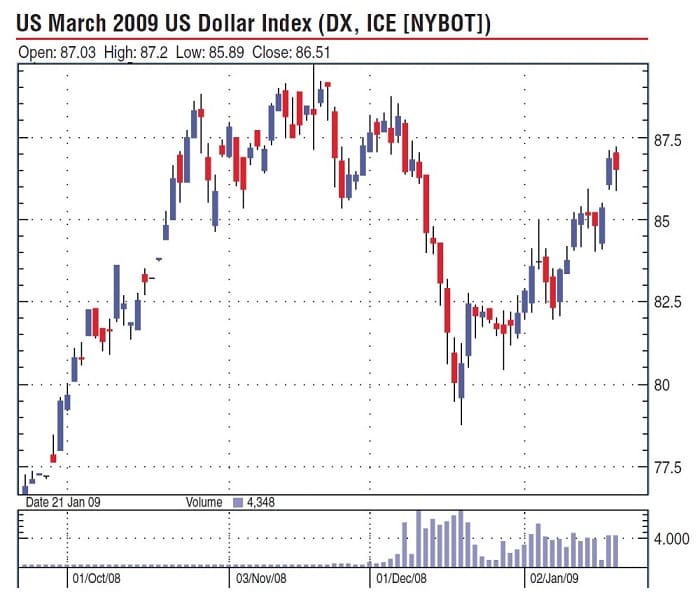
Any trade should first be evaluated based on the US dollar index, since that index is the most powerful determinant of direction for all other major currency pairs. In Figure 1, note that the index has been in an uptrend since September 2008. If you apply the Fibonacci indicator, you can determine that the dollar index on a daily chart is also trading and has been trading just above the 0.618 level. Does the index retrace or hit its upper extensions? The answer may mean the difference between a good or bad trade with many pips of profits or losses. There are a number of ways to evaluate this situation.
The dollar positive trades would be the USD/JPY (United States/Japan), USD/CHF (US/Swiss), and USD/CAD (US/Canada). From its 300 low to its 3000 close, USD/CAD has been in an uptrend following the rise in the dollar index and has hit its 0.786 or 79% Fibonacci on the daily and 0.618 on the weekly. Similarly, USD/CHF has hovered between the 0.50 and 0.618 on the daily charts (Figure 2) and 0.50 on the weekly charts from its 0.700 bottom to its 1.290 or so high.
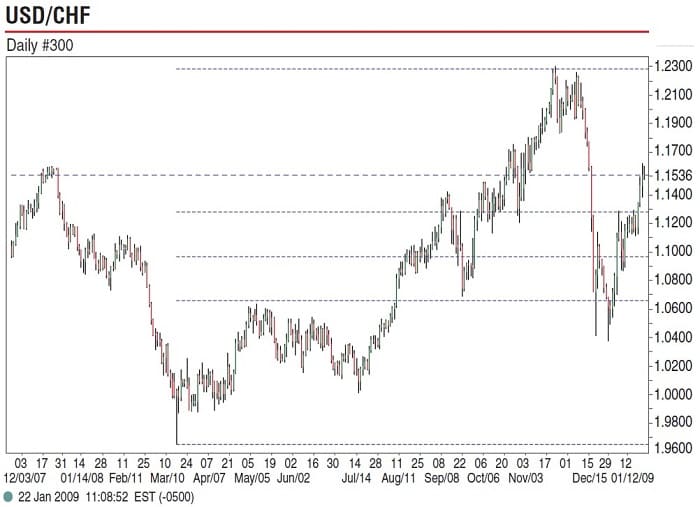
Yet the USD/CHF has also hit the upper Fibonacci extensions on the daily and weekly charts from its 0.9649 low to its 1.2295 high. It’s following the dollar index closely. The only pair that has not engaged in a similar trade is the USD/JPY, which hasn’t even come close to its 0.382 Fibonacci on any time frame. For the USD/JPY, it is unusual for this correlation to break. Economic fundamentals or a change in central bank policies can only be reasons for this correlation to change. This correlation can only indicate to traders to stay away from trading this pair until the correlations can be better understood. Normally, this pair should have followed perfectly with the dollar index the way the USD/CAD and USD/CHF did.
Suggested Books and Courses About Forex Trading
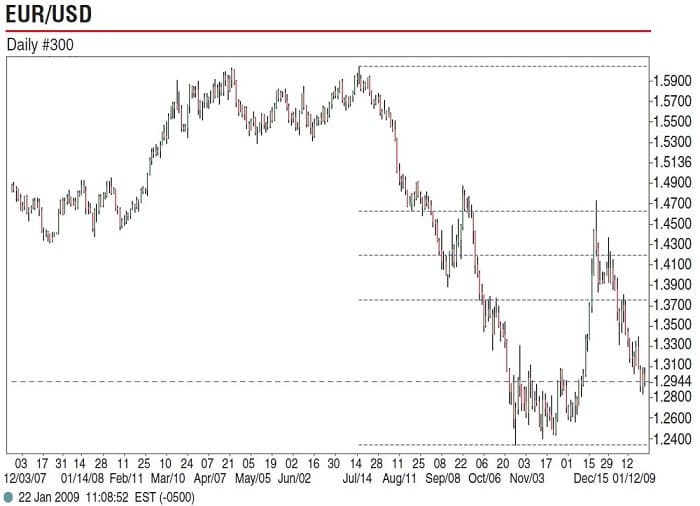
Conversely, the dollar-opposite trades would be EUR/USD (European Union/US), GBP/USD (Great Britain/US), AUD/USD (Australia/US), and NZD/USD (New Zealand/US). From its 1.60 high to its 0.230 low, the EUR/USD is barely at its 0.786 Fibonacci on the weekly chart and barely at its 0.786 Fibonacci on the daily chart (Figure 3). It’s the same for the GBP/USD from its 2.100 high to its 1.4500 low.
Looking at AUD/USD and NZD/USD, we can determine that AUD/USD’s high of 0.9849 to its 0.5996 low and NZD/USD’s high from 0.8200 to its low of 0.5200 shows that both are trading at their Fibonacci 0.786 or 79% on both the daily and weekly charts. Fibonacci analysis indicates that an important and strong support may be in place for the dollar-opposite trades and there is a strong chance a trend change may occur.
THE BIGGER PICTURE
The larger picture highlights importance and accuracy by using the dollar index as a basis for trades as a rise in the dollar index correlates to a rise in the USD/CAD, USD/CHF, presumably USD/JPY, and a downtrend in the EUR/USD, GBP/USD, AUD/USD, and NZD/USD. But note the difference in pips within the downtrends and uptrends. Not all pairs have perfect correlations to the dollar index, nor do all pairs have perfect correlations among each other. Between AUD/USD and NZD/USD, the difference is 853 pips, more than between the GBP/USD and EUR/USD. It’s the same principle between the USD/CHF and USD/CAD. Although the dollar index may be a good way to evaluate a trade, other factors may have to be evaluated to further confirm proposed trades.
LONG AUD/USD
For example, suppose you are contemplating a long AUD/USD position. What would be the determining factors to confirm this trade? The first factor would be to ensure that indicators correlate for NZD/USD, since both are so heavily correlated. The second factor would be to look at cross-rates such as AUD/NZD, since AUD/USD and NZD/USD move directly opposite AUD/NZD. A downtrend in AUD/NZD is an uptrend in AUD/USD and NZD/USD. To determine if this trade is a real trend or just a correction, it is a good idea to confirm through the EUR/USD and GBP/USD. A long AUD/USD is the same as a long EUR/USD and GBP/USD. While all may not have the dollar index at their disposal, the EUR/USD would serve as direct confirmation since the EUR/USD moves in contrast to the dollar index.
LONG OR SHORT GBP/USD
What about a long or short GBP/USD? You would confirm this through the EUR/USD, since both are so heavily correlated and both are more widely traded than AUD/USD and NZD/USD. Further confirmation comes from the EUR/GBP. A long GBP/USD is a short EUR/GBP because of its direct opposite movement due to correlations. You could also check with a direct opposite such as the USD/CHF. This answer would further confirm GBP/CHF. A long GBP/USD usually means a short GBP/CHF in most instances, although this correlation changes constantly.
LONG OR SHORT USD/CHF
How about a long or short USD/CHF? Again, we must confirm this trade through the EUR/USD, since the EUR/USD is the most direct opposite of the USD/CHF. Further confirmation is determined through the GBP/USD or by looking at dollar index positives, USD/CAD or USD/JPY. The first cross-rate to determine strength of direction would be EUR/CHF. EUR/CHF moving in the same direction as the USD/CHF is a positive sign of a strong trend. Normally, however, they move opposite each other, as quote currencies USD and EUR are opposites.
LONG OR SHORT USD/JPY
Traditionally, the direct opposite of USD/JPY has always been the EUR/USD because the USD/JPY has always had a strong and positive correlation to the dollar index. Because this correlation has broken down, the GBP/USD may serve as a confirmation, or dollar positives such as the USD/CHF or USD/CAD may be better confirmations. A number of cross-rates may offer good indications for direction. CHF/JPY is one pair since it is negatively correlated to USD/JPY. One reason why the dollar index and USD/JPY correlation may have broken down is due to the selling of the yen carry trades such as the EUR/JPY and GBP/JPY. During good economic times, the yen carry trade sours while recessions bring heavy selling. This would affect USD/JPY by keeping its prices low and contained.
CORRELATION TO COMMODITIES
The EUR/USD is one of the most widely traded pairs among the major currencies. It has a direct negative correlation to the dollar index, the USD/CHF, USD/CAD to a large degree, and traditionally, the USD/JPY. Its most closely related pair is the GBP/USD. The EUR/USD can have at times an inverse relationship with the EUR/JPY, while at other times it can have a more positive relationship. New Zealand’s economy is heavily dependent on commodity exports. Traders can evaluate a NZD/USD trade by tracking the CRB index since both are so heavily correlated. Another way to confirm is through the AUD/USD, since it is directly correlated. EUR/NZD would be a further confirmation, as these two pairs move directly opposite each other.
Canada’s relationship with the dollar index is without question. The Fibonacci numbers track so closely to the dollar index. Yet daily market movements in the USD/CAD can be quite sporadic. Canada and the US share trade across their borders, so one reason for this sporadic movement is that corporations wish to lock in favorable trade rates during any trading day and vie for favorable rates. But one way to further evaluate Canada’s and other currency pairs trade directions is to look at other markets such as oil and gold.
OIL AND GOLD
Australia was once the world’s third-largest producer of gold with exports totaling about $5 billion. As a direct result of this exportable commodity, AUD/USD rises along with the price of gold. This in turn sends the dollar index down, the NZD/USD up, and at times the USD/CHF as well. The Swiss franc was once backed by gold reserves, but recent legislation has repealed this law. The USD/CHF correlation is no longer stable, so that long AUD/USD position can be evaluated by the price of gold.
The pure gold play would be the South African rand (ZAR), USD/ZAR, since South Africa is the world’s largest exporter of gold. So when gold is up, AUD/USD, NZD/USD, EUR/USD, and GBP/USD all rise while the dollar index falls along with USD/JPY and USD/CHF. Oil is another valuable commodity that heavily affects the currency markets and can be used to evaluate trades.
When the price of oil rises, the dollar index falls, USD/JPY falls, USD/CHF falls, and USD/CAD falls. While Canada may be a large producer and exporter of oil and a major supplier to the US, a rise in the price of oil actually has a negative effect on the USD/CAD relationship. So a rise in the price of oil is a short trade for USD/CAD. One way traders can take advantage of rising oil prices is to go long CAD/JPY. Another way to take advantage of a pure commodity trade is to evaluate AUD/CAD. From its 0.9830 July 2008 high to its October 0.7142 low, the correlation to Australia’s metals and Canada’s oil is without question.
TREASURY BONDS
Traders can also evaluate currency trades through US Treasury bonds. When Treasury bonds are sold, yields rise. This is a positive development for the dollar index, USD/JPY, USD/CHF, and USD/CAD, and negative for EUR/USD, GBP/USD, AUD/USD, and NZD/USD. This relationship holds as a constant and rarely breaks down. US stock markets play a significant role in evaluating trades.
The relationship with currency trades works like this. A rising stock market is a dollar-positive development for not only USD/JPY, USD/CHF, and USD /CAD but is also positive for carry trades such as the GBP/JPY and EUR/JPY. The relationship is negative for dollar opposite trades such as the EUR/USD, GBP/USD, AUD/USD, and NZD/USD. This relationship is negative simply because traders are selling bonds, gold, and oil, and seeking higher yields elsewhere.
FIBONACCI NUMBERS
The last point to highlight is the factor of Fibonacci numbers and their use as an evaluative tool to determine trades. Fibonacci numbers are directly translated to rises and falls in each of the positive and negative correlations of currency pairs. The numbers are not absolutely perfect as some pairs overshoot or fall short of their exact dollar index target, but the relationship is close enough to base a profitable trading decision.
PERFECT CORRELATION?
These correlations are not perfect. The use of these high-lighted correlations does break down in their relationships from time to time. Normally, these situations are rare but traders would have an early awareness of the economic factors that would cause this breakdown, since markets would all not have the same correlation.
Brian Twomey is a currency trader and professor of political science at Gardner-Webb University.