Trading Articles
Do You Need Volume To Move Stocks Higher By Michael Carr
Many analysts are pointing to lower than average volume in stocks as a reason to expect a price decline. This seems logical, but test data works better when it comes to making investing decisions. Wall Street adage says that stocks can fall on their own weight with relatively light volume, but it takes strong volume to push prices higher. This is based on the idea that volume represents demand. As markets have evolved over the years, many traditional sentiment and breadth indicators have failed to withstand the test of time. Volume may have been required to push stocks higher when market makers were on the other side of every trade and short-term trading was rare. But given the changes to the market structure over the years, volume by itself may not be as reliable an indicator as it once was. Selling can occur for a variety of reasons and on heavy volume, while buyers may accumulate long positions in derivatives markets, leading to higher prices on lower volume as arbitragers profit by eliminating the intermarket spreads.
Many commentators have pointed out that the recent market action comes with volume consistently below its 50-day moving average. Standard wisdom says this is a period of distribution in the market and is therefore likely to lead to lower prices in the short term. This is shown in Figure 1. Visually, there is no apparent relationship between volume and its moving average. Into the March bottom, volume was consistently greater than average, just as it was after that bottom was reached. While it is possible to say that volume confirmed the decline, there is no guideline to assess when it began confirming the new uptrend. In short, this appears to be an arbitrary rule of thumb, and testing shows that no reliable mechanical rule can be easily found from this relationship.
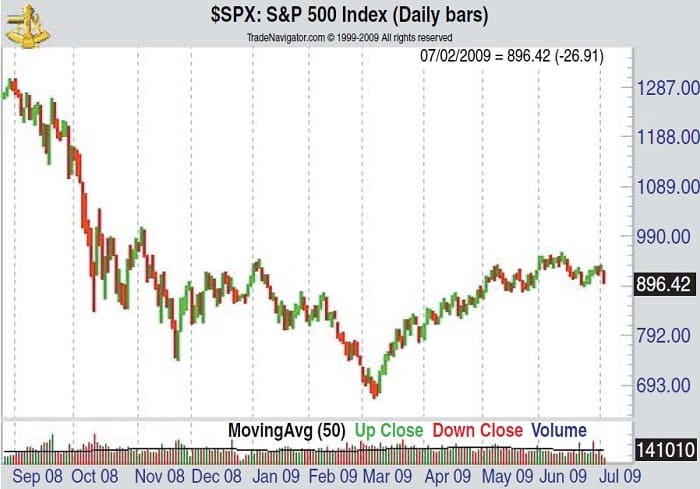
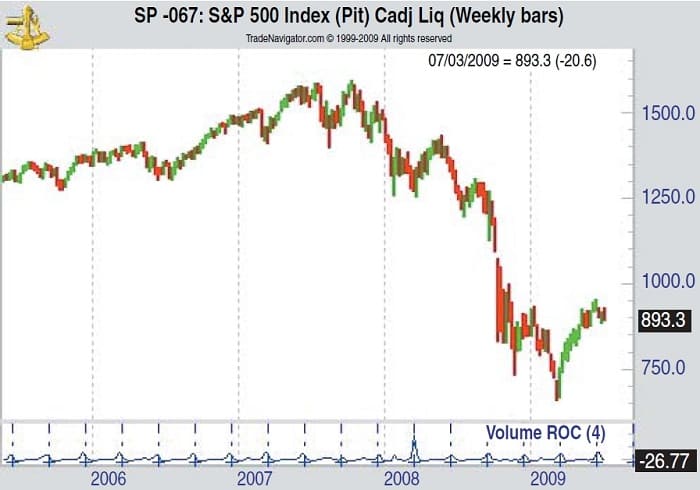
We can also see from that chart that volume appears to move randomly while prices exhibit periods of trending behavior. Looking at the weekly chart in Figure 2, we see that volume appears to follow a well-defined three-month cycle. This chart uses the four-week rate of change in volume to identify significant increases and decreases in trading activity. The spikes occur every three months and are associated with the expiration of the contracts underlying the index in the futures and option markets.
Given the changes in market structure over the years, volume may not be as reliable as it once was.
Given that there will be a spike in volume every 90 days, the use of the 50-day moving average to assess the importance of volume in the stock market makes little sense. The moving average will be prone to sharp changes as the time period with this spike is added to and removed from the average. Other technical tools may provide more useful insights. One of the first attempts to find quantitative meaning in the price/volume relationship is the development of the on-balance volume (Obv) indicator. Joseph Granville introduced Obv in his 1963 book, Granville’s New Key To Stock Market Profits. The calculations are simple:
- If the market closes higher than the previous day, the volume is added to the previous day’s Obv.
- On a down day, the volume is subtracted from the previous day’s Obv.
Suggested Books and Courses About Market Indicators

A simple interpretation of Obv is to assume that it confirms price action if an increase or decrease in price is accompanied by increasing volume. Divergences occur when increasing or decreasing prices are seen with decreasing volume. Granville thought that this meant the price action was weak and more likely to reverse than continue in the direction of the trend. Obv is shown in Figure 3. Testing fails to confirm that this indicator adds value to the analysis of the trend.
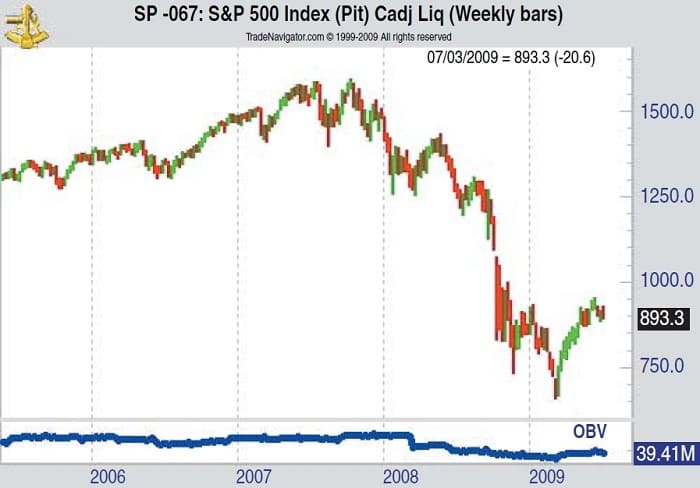
In part, Obv fails to work reliably because it does not recognize that for each buyer there must be a seller. It is naïve to assign all of the daily or weekly volume to buying or selling pressure. More sophisticated tools have been developed that allocate part of the volume to the cumulative indicator in proportion to price action. Well-known examples of this are the Chaikin oscillator, the money flow index, and time volume accumulation (Tva). The Tva assigns only that part of the volume that drove the price change to the indicator, ignoring the rest of the activity as market noise. The formula for Tva is:
MovingAvg (Volume * (Close – Close.1) / (True High – True Low), NumBars)
When backtesting with Tva, you do discover that meaningful and profitable information is contained in volume. On a daily time frame, a highly profitable system buys the market whenever the 10-day Tva is greater than its eight-day moving average. The test is designed only to capture the idea that increases in volume are bullish and therefore trades are closed one week later on a time stop. Using the Standard & Poor’s 500 exchange traded fund (ETf)(Spy), this strategy is profitable over daily and weekly time frames. Weekly trades are closed one month later.
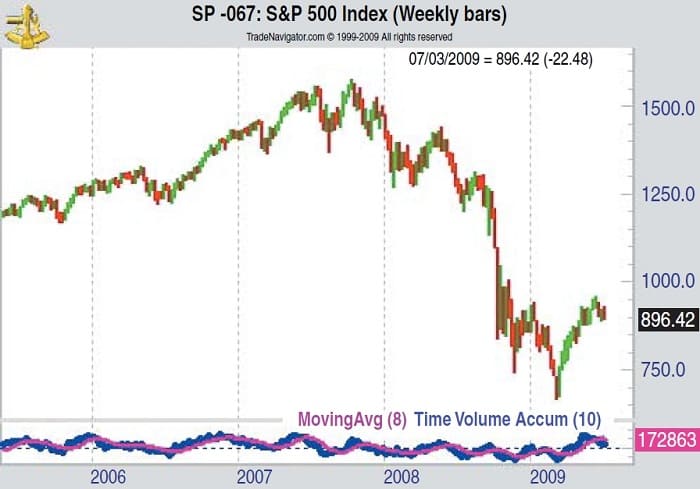
The parameters used in the test were selected through optimization. While 10,000 tests were completed, parameter stability was found around these levels, which adds confidence to the analysis. In early July, on the daily chart (Figure 4), Tva is whipsawing around its moving average. This does not offer meaningful insight into the likely course of market action. The weekly chart is not bullish with Tva below its moving average. We cannot say that it is necessarily bearish since testing with volume indicators did not yield any identifiable advantage to shorting the market.
Testing indicates that the adage is right; markets do require volume to move higher. Unfortunately, more sophisticated analysis than relying on a moving average is required to determine whether volume is bullish. Investors should also be aware that a lack of volume, while not bullish, is not necessarily bearish.
Michael Carr is chief market strategist at Dunn Warren Investment Advisers. He is a member of the Market Technicians Association, the editor of the Mta’s newsletter, Technically Speaking, and is the author of Smarter Investing In Any Economy.