
Trading Articles
Trading Trendline Breaks (Part 3): A Winning Game? By Sylvain Vervoort
In the first part of this series, we examined the application of trendline breaks. In the second part, we studied a basic system for creating trendlines. This, the third and final part of this series, takes a detailed look at how the system can be applied.
THE FIRST EXAMPLE
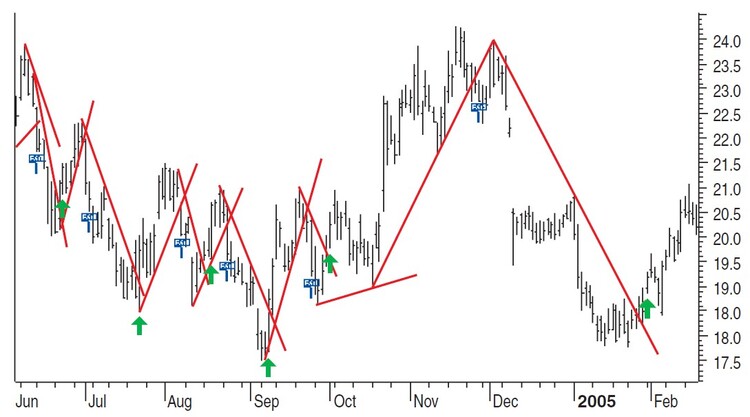
Previously, I discussed how trendlines are plotted and how they can be used. This time, I am going to show you Abercombie & Fitch Co. (ANF). The numbers here represent the labels on the chart displayed in Figure 1:
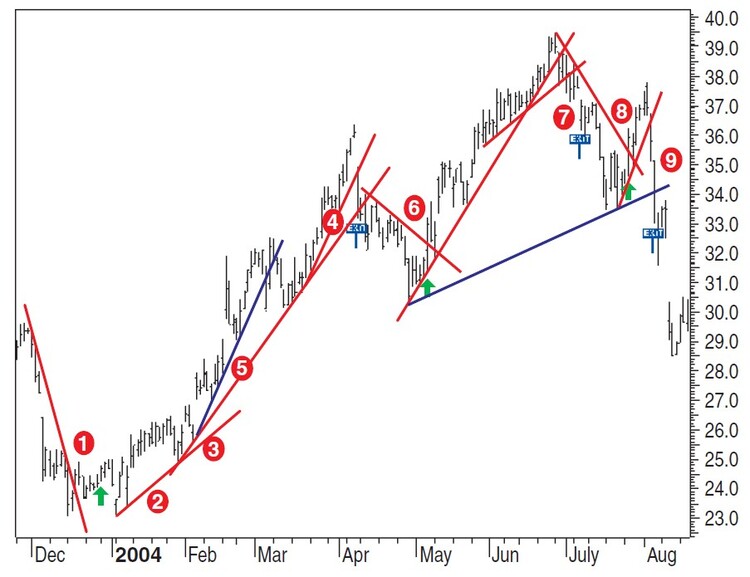
- There is a clear downtrend line break. There is a buy signal generated by the trendline break simulation system (green up arrow) at about the same level of the trendline break. You open a long position. Typically, you would set a stop-loss just below the previous low.
- The next trend is up.
- In February the trend starts accelerating. You could either go for the red uptrend line at the beginning of the acceleration or the blue uptrend line that starts shortly thereafter, which is even sharper. Applying the trendline rules as proposed in part II, you would, however, end up trading along the red uptrend line.
- The end of the sharper uptrend line is not important because you would end up closing your position at around the same price (the blue exit sign), whether you are following trendline 3 or 4.
- The sharper uptrend line that initiates from trendline 3.
- The last top is a typical example of a sharp move down at the top. In such a scenario, you should wait a couple of days before you start to draw the downtrend. This is because you want it to start from a different bar than the high bar. When this downtrend line is broken, you can open a new long position.
- The uptrend line that started in May is broken. You might as well accept that the trend is beginning to slow and is near the end. There is another less steep trendline that also is broken. In both cases the trendline breaks take place before the system exits.
- The downtrend line is broken, which means you can open a new long position.
- The uptrend line is broken. The long position is closed. Whether you were using the break of the sharp uptrend line or the break in the longer-term uptrend, the system would close the position at around the same time.
The decisions made by the simulated system test are in line with the breaks in the manual trendlines. In fact, entering and exiting positions based on the manual trendline may have been more profitable.
THE SECOND EXAMPLE
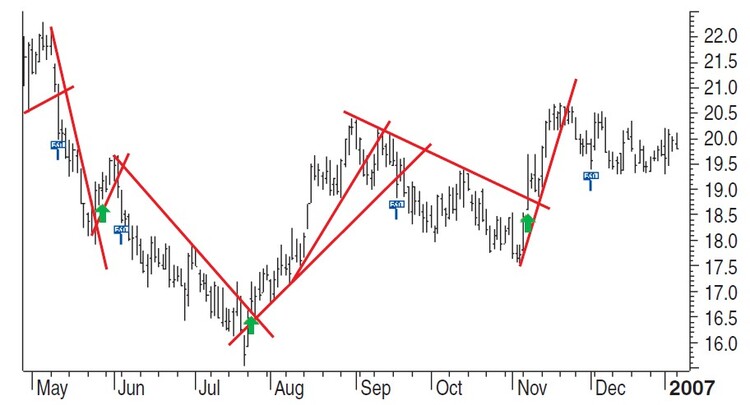
With the Goodyear Tire & Rubber Co. (GT) (Figure 2), the numbers on the chart signify:
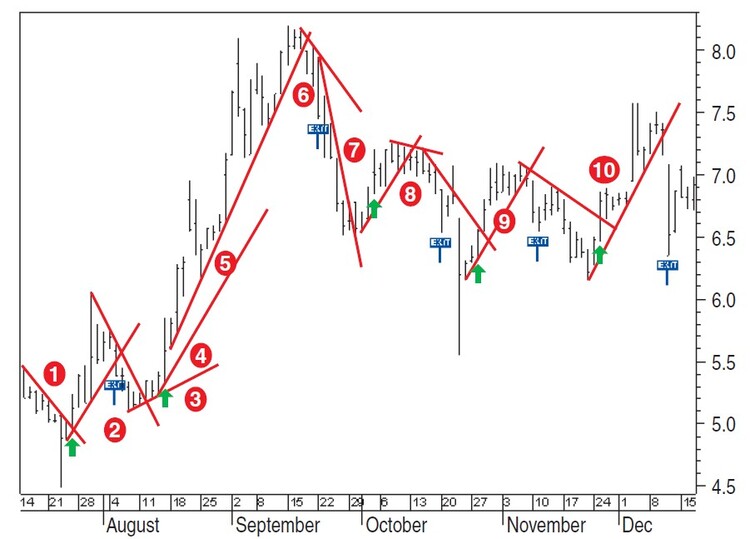
- The downtrend line break and system buying signal (green up arrow) appear at the same time.
- The exit (blue exit sign) and the uptrend line break coincide well. Note that the start of the uptrend line was a day later than the low. This is because that low was a large single-day move.
- The downtrend break based on the trendline takes place a couple of days earlier than the system buy.
- Acceleration in the trend that shows some trend direction was given by the low of the first two bars.
- The real trend follows the same inclination as trendline 4 but is slightly displaced. We will use the displaced uptrend line since it is more accurate.
- Again, the break in the uptrend line break takes place earlier than the exit generated by the system. Exiting at the trendline break would have resulted in a larger profit than closing the position at the system exit.
- The downtrend accelerates and is broken. You can see from the chart that you could have opened a new position at a lower price a couple of days earlier than the system buy signal shown as a green up arrow.
- This break in the uptrend line again takes place earlier than the exit signal generated by the system.
- Here, the break in the downtrend line appears a day later than the entry generated by the system. However, the price at which you would close this position takes place.
- This break in the uptrend line again takes place earlier than the exit signal generated by the system.
- Here, the break in the downtrend line appears a day later than the entry generated by the system. However, the price at which you would close this position takes place a day earlier than the system exit.
- The downtrend line break and the system entry take place on the same day. Interestingly, the break in the uptrend line break also happens on the same day.
THE THIRD AND LAST EXAMPLE
Finally, I’m going to leave you with a few charts of Altera Corp. (ALTR)(Figures 3 to 5). Study them and determine if the signals generated by the trendline break simulation system is close enough to the manual trendline breaks. If so, you can accept the test results as valid for applying manual trendline breaks.
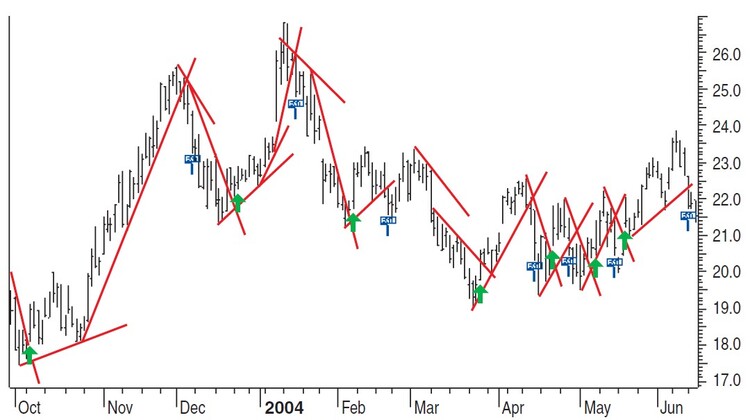
While looking at these charts of Altera, keep in mind the trendline theory as it was explained in the second part of the article. Although you can react differently to price evolution, in most cases this will not have a significant impact on the final result after a longer period.
Advanced Books and Courses on Technical Analysis



TEST RESULTS
First, we will only trade long positions. Each stock will receive the same cash amount of $1,000 from the start. It can make 100% use of this value. It will not share profit or loss with the other stocks in the test group. This has the advantage that you cannot easily lose more than the $1,000 cash start value in a single stock. However, to be sure of this at any time and at any value, we must set a stop at 100% loss or less. Trade execution is at the closing of the signal day. We count a 0.1% cost opening the transaction and also 0.1% cost to close a transaction.
BULL MARKET, LONG POSITIONS ONLY
What kind of results can you expect in a bull market, if you are only taking long positions?
Dutch market: Starting January 10, 2007, I used a lookback period of the past 1,000 trading days. This means I would be using a period that spans from the beginning of 2003 to early 2007, which is a longer-term bull market. I will start with the Dutch market since it is one I am familiar with. I took 98 stocks that represent the Dutch market grouped in the AEX index, the MIDCAP index and those classified as others. With 98 equities and a$1,000 per equity, the total cash value I started with was $98,000. You can see the results in Figure 6. The system resulted in a profit of $280,690, or 286%total with an average of 15 trades. That is a compounded yearly interest of 40%.
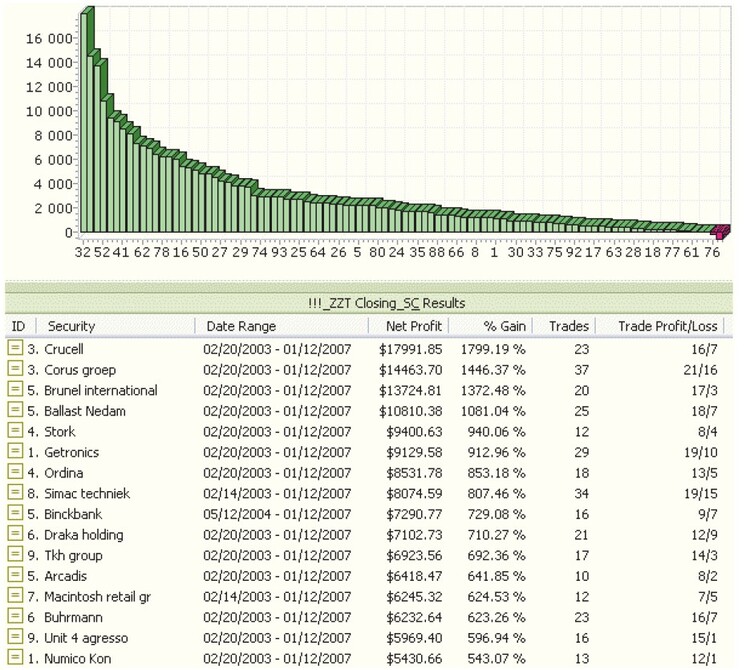
10-bagger stocks: Remember the STOCKS & COMMODITIES article “The Search For The 10-bagger Begins” by Thomas Maskell? Maskell came up with a 10-bagger stock list. I downloaded the data for these stocks, and 212 of them are left in my list today. So I thought of trying the test system on these 212 stocks under the same test conditions.
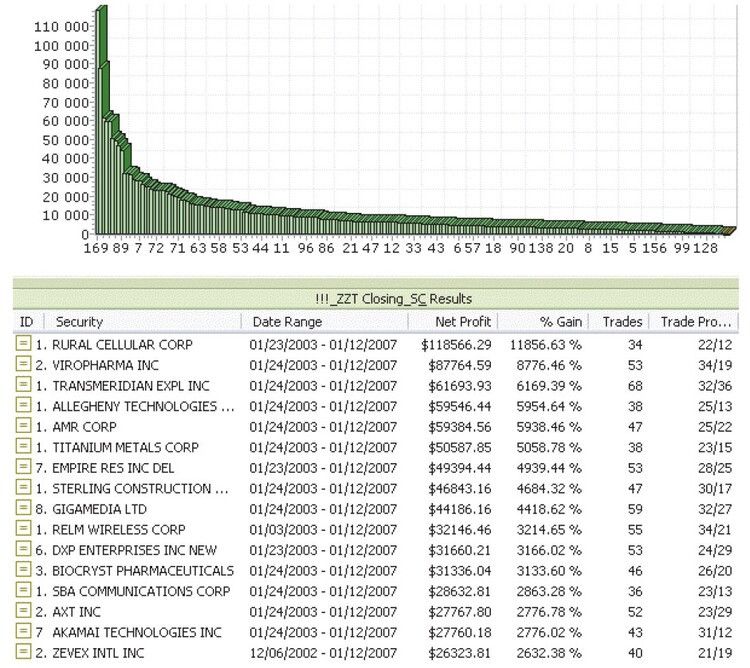
With 212 equities and a $1,000 per equity, the total cash value at the beginning is $212,000. The results (Figure 7) show a profit of $2,088,824 or 985% total with an average of 41 trades. That is a compounded yearly interest of more than 80%. Rural Cellular Corp. came out ahead, making $118,566 from a starting capital of$1,000 in four years.
BULL MARKET SHORT POSITIONS ONLY
What kind of a result can we expect in a bull market by only taking short positions? Let’s assume we are persistent contrarian investors and believed that the entire bull market from 2003 till mid-2007 was a bear market.
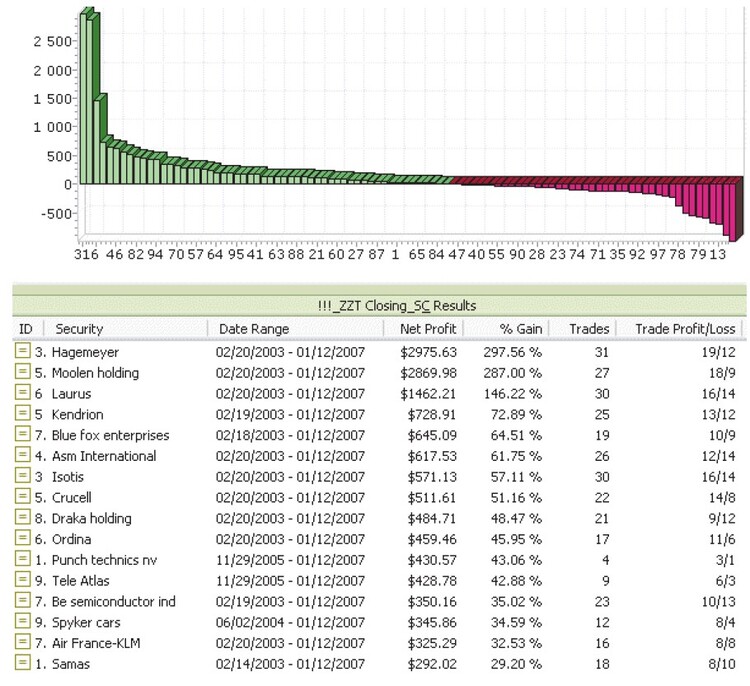
Dutch market: Looking back over a period of 1,000 trading days will bring us to the beginning of 2003. The data used here ranges from early 2003 to January 10, 2007, which is a longer-term bull market. Again, I used the 98 stocks that represent the Dutch market grouped in the AEX index, the MIDCAP index and those classified under others. With 98 equities and$1,000 per equity, the initial cash value is $98,000. Short positions are treated in the same way as long positions. They must be covered with a 100% margin. The result (Figure 8) is still a small profit of $9.164 or 9.3%total with an average of 15 trades.
TRADING ON TRENDLINE BREAKS
It looks like trading on trendline breaks as presented in this series of three articles really is worth a try. Trendline break techniques as presented, combined with stop-losses and the individual attribution of cash and profits or losses to individual stocks, can be a winning game. It is a pity we can’t use this system test simulation in real time. With my own trading, I have been using mechanical systems that trade like trendline breaks. Before placing an order I will always look at the chart first and try to avoid losing trades when a mechanical buy or sell signal is given.
- Sylvain Vervoort is a retired electronics engineer who has been using technical analysis for more than 30 years. He is an independent trader, writer, publisher (in Dutch), and educator in technical analysis and options.