Trading Articles
Trading Commodities With Candlesticks By Stephen W. Bigalow
Here’s a trading setup that will stop you from being shaken out of your positions, especially on longer-term time frames. The volatility of price movement in the commodities markets frightens off investors. Horror stories about accounts being wiped out in a flash are enough to make them think twice about venturing into unfamiliar territory. For those who do not want to take a lot of time and effort to learn how to invest in commodities correctly, the best advice is probably to stay away from them. But for the investor who is willing to take the time and effort to assemble the ideal trading program for themselves, commodity trading can be lucrative. Unfortunately, the road to successful commodity trading can involve gut-wrenching, emotionally debilitating learning processes. Few investors immediately have the knack to invest in commodities without suffering painful losses.
FIRST, HAVE A SYSTEM
Before you start trading, you must have a trading platform that has proven to be successful. Without an investment method that provides you with an advantage, you will just be shooting from the hip. There must be a reason for anticipating the price of a stock/commodity/currency to go up or down. Many investors start committing their funds to market exposure well before they have researched a trading program.
Fortunately, candlestick analysis provides a trading method that works. It has proved to be a viable trading format over three centuries. The information incorporated into each individual signal has powerful implications. Analyzing a series of signals and establishing a pattern creates higher probabilities of being in the proper trades at the correct time.
A major benefit of candlestick analysis provides a common-sense element for analyzing what is occurring between the bullish and bearish sentiments. The legendary Japanese rice traders who devised this technique incorporated elements of common human nature reactions into their analysis: panic selling at the bottom and exuberant buying at the top. Once you have learned how to utilize that information successfully, your trading abilities will improve, no matter what investment entity or time frame you trade. Candlestick signals work well in isolation, but adding confirming indicators make them work even better.
UNDERSTANDING CANDLESTICKS
Having the ability to recognize where a reversal might be occurring gives the investor an advantage and the ability to generate profitable returns. In addition, knowing the psychology that created the signals develops valuable insights into price movements. This is the knowledge the professionals have accumulated over years of trading. This allows you to evaluate what the prices should be doing versus listening to others who think they know what the prices should be doing. To trade successfully, you need to understand what your indicators are telling you.
Because candlestick analysis involves visual interpretation, it is an easy process to learn. Common sense is all that is required to analyze successful trades. The confirming indicators are relatively simple. For example, the stochastic indicator tells you whether a trend is overbought or oversold. A candlestick buy signal occurring in an oversold condition increases the probability of a trend reversal occurring. The same is true when witnessing a candlestick sell signal in overbought conditions. The moving averages works effectively as support and resistance levels.
THE TEE LINE
The eight-period exponential moving average, referred to as the tee line, creates a profitable trading indicator. The longer a price trend remains in existence, the more important the tee line becomes. Prices usually remain fairly close to the tee line so the line can improve your entry and exit strategies. Thus, adding the element of price and also closing above the tee line in your analysis will improve the probabilities of a reversal occurring. The same is true when witnessing a sell signal in the overbought condition, closing below the tee line.
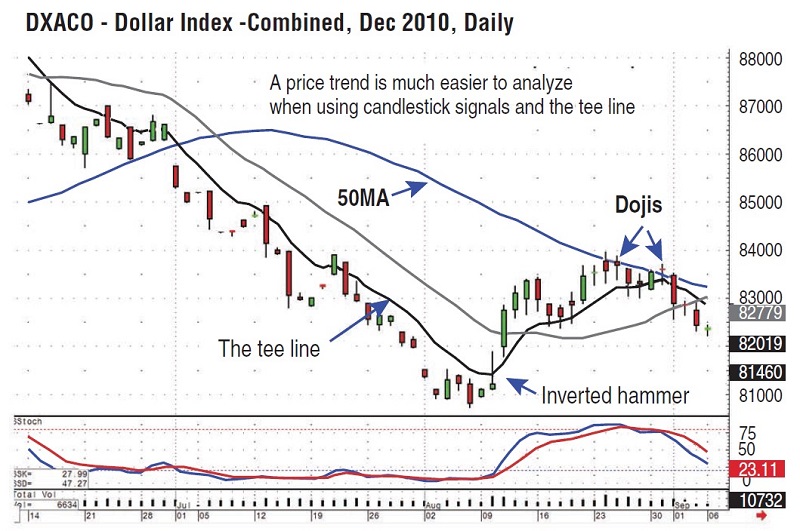
As can be seen in the US dollar chart in Figure 1, the tee line acted as a compelling resistance level during the down-trend. It was not until the appearance of the inverted hammer signal, followed by confirmed buying above the tee line, that an uptrend was established. The next major target was the 50-day moving average. The candlestick investor has an advantage here because he/she can analyze the nature of investor sentiment when important technical levels are reached. The dojis at the 50-day moving average revealed indecisiveness at those levels. With stochastics in overbought conditions, the probability of the end of the uptrend was fairly strong.
Another function of the tee line can be seen in the December wheat chart (Figure 2). It had all the elements for taking profits. After a persistent uptrend, the magnitude of the bullish candles revealed buying at the top. Another major indicator that a top was near was the distance the price had moved away from the tee line. Note how the uptrend started with a bullish engulfing signal in late June. The tee line was very effective in showing the continuation of the uptrend. The buying could be seen with the large bullish candles and the price having moved away from the tee line. This became the area to start watching for a candlestick sell signal.
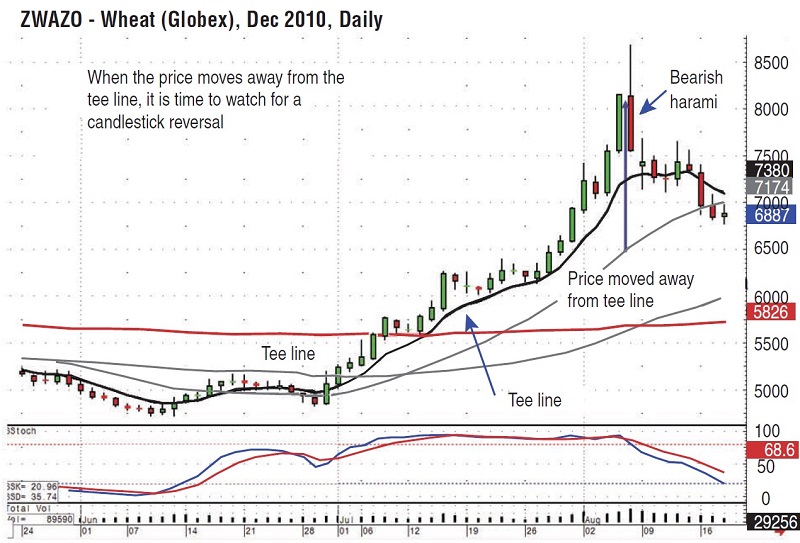
The bearish harami, one of the major candlestick reversal signals, appeared in August, revealing the bullish price trend was over. It was time to take profits. Candlestick chart patterns work as effectively on a one-minute chart as they do on a daily or monthly chart or any other time frame. The signals represent the cumulative knowledge of all buyers and sellers during a specific time frame.
Suggested Books and Courses About Candlestick Patterns
QUICKER EXITS
Because of the leverage and volatility of commodity prices, gains and losses occur in a much shorter time frame than most stock transactions. This creates a different dynamic for how and when to take profits and losses. Most technical analysts will tell you to cut your losses short and let your profits run. Unfortunately, few traders really understand what that means. Candlestick signals provide the common sense behind trading platform mechanics, which becomes a critical aspect of trading commodities. Candlestick signals indicate when it is time to get into a position and when it is time to get out. If the time to get out is indicated 10 seconds after you get in, you do what the candlestick signals tell you. That is one of the most difficult things for investors to understand. However, the information built into candlestick signals provides a format for taking quick and small losses when showing a trade has failed.
Most investors lose money because of the weight of their emotional burden. The pressure of producing positive results is a streaming process. It does not end when you make that decision to buy. The initial purchase of a position requires continued decision-making input each minute, hour, day, or month, depending on your holding period.
When you decide to buy soybeans, for example, you have made a decision that will improve or diminish your asset value. Once the price starts moving from your point of entry you need to be in a constant decision-making mode. Do you take profits here? Do you cut losses there? Do you continue to hold? Emotions become an integral part of the trading process. Beyond the decision to take a profit or loss, other questions will go through your mind, questions like, “Will I look stupid if I sell for a loss and the price immediately turned around and goes in the direction I first projected?” or “Will I look stupid if I had a profit and let it turn into a loss?” This is why it is important to have a system in place before you trade. Combining candlestick signals with indicators and the tee line will reduce the decision-making process and improve the profitability of your trading.
MAKING BETTER DECISIONS
There is no investment program that works with 100% accuracy. How do we address this? If we don’t understand the mechanics of a trade or investment, our emotions become involved. If we learn how our own minds operate in all aspects of price movements, whether adverse or successful, we can make better decisions.
Even though candlestick analysis incorporates information into the signals that could produce a successful investment strategy, you still must know how to control your emotions. Logic dictates that if a trading program is consistently successful, you should be able to make money with it. If you’re losing money with a trading program that has proved to be successful, it is probably because of how you are applying it. Talk to any successful investor and they will tell you they went through many emotional traumas before they succeeded. They have experienced enough scenarios that helped them learn what to do in trading situations. Take the time to understand the markets using candlesticks. Candlesticks are basic and allow you to maintain a profitable investment discipline.
Stephen W. Bigalow, the author of Profitable Candlestick Investing, Pinpointing Market Turns To Maximize Profits, and High Profit Candlestick Patterns, is also principal of www.candlestickforum.com. As a consultant, he has developed multiple successful trading programs, utilized in his candlestick trading hedge fund.