Trading Articles
Top 10 Candles That Work By Thomas N. Bulkowski

Which candlestick patterns trend the most in 10 days? In my last article, I described 13 candlesticks that worked best as reversal or continuation patterns. That means price closed above the top of the candle pattern or below the bottom of it, signaling a reversal or continuation not just once, but reliably in thousands of cases. However, just because a candle acts as a reversal 66% of the time doesn’t mean that price moves far beyond the candlestick boundaries. This article discusses candles that perform best over time — that trend furthest — but they may not be good reversal or continuation candidates.
START AT THE BEGINNING
Doing research on candlesticks means making decisions on how to test them. How do you determine the best performance? Since candles are often short-duration patterns (most are three price bars or shorter), their trend often does not lead to a big, long-duration move. I would make that statement based on working with chart patterns, where the tallest ones outperform their shorter brethren, but also from testing more than 100 candlestick types using daily price data and 4.7 million lines (a candle line is a single price bar).
I decided to measure the price move from the close of the day the candle pattern ended (not the breakout) to one, three, five, and 10 trading days into the future. This article discusses the 10-day performance results in a bull market. For details on other varieties, such as bear market performance over five days, please refer to my book Encyclopedia Of Candlestick Charts.
UP BREAKOUTS: COLLAPSING DOJI STAR
The top-performing candle with an upward breakout is the collapsing doji star. I show the ideal configuration in Figure 1. It’s a three-line pattern with an uptrend leading to the start of the candlestick. The first line is white, but it can be tall or short. What matters is that it gaps above the next candle — a doji. A doji has no body, meaning that the opening and closing prices are the same (or nearly so). Often, you see doji that look like plus signs or crosses on the price chart but more rarely as minus signs in thinly traded stocks (called a four-price doji).
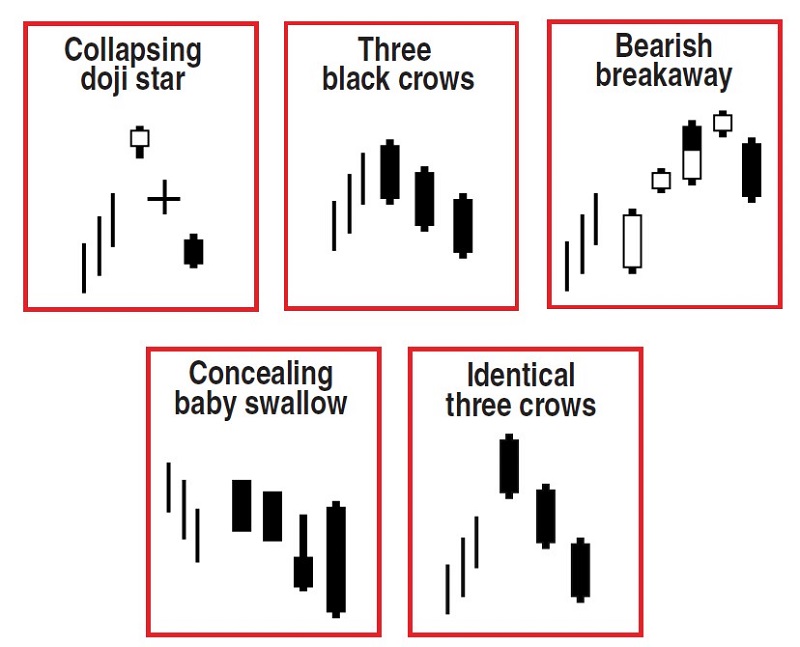
The shadows (the thin line on the top or bottom of a candle, also called wicks) of this doji should not overlap the shadows of the adjacent candle lines. The last bar is a black candle that gaps below the doji, like that shown in Figure 1. The good news with this candle is that price climbs an average of 7.32% over the 10 trading days after the candle ends. If you prorate that for a full year, that’s a gain of almost 200% using 260 trading days annually. The bad news is that the gain is probably wrong. Why? Because I only found 16 examples out of nearly five million price bars searched. Thus, if you can find the candle, the performance may not meet your expectations.
THREE BLACK CROWS
Three black crows is a candle pattern that is easily remembered. Look for the candle in a rising price trend followed by three tall black candles, each closing at a new low (relative to the prior candle). In this case, “tall” means a candle that is taller than the average candle height over the past week or two. The last two candles must open within the body of the prior candle and all should close near the low.
Figure 1 shows an example of what the ideal three black crows should look like. Note how the candle lines overlap and trend downward. Since price is dropping in the three-line pattern, it is easy for price to close below the bottom of the pattern, staging a downward breakout. Thus, the pattern acts as a bearish reversal of the uptrend. However, the best performance, placing second among all the candlestick types in a bull market, is when price breaks out upward. Over 10 days, the average gain is 6.95%. Upward breakouts are rare, happening 22% of the time, but they are worth looking for. How often does this candle appear in the wild? It’s not as plentiful as hair on a gorilla, but it ranks 60th out of 103, where a 1 ranking is the most plentiful. That’s very good compared to other candles mentioned in this article.
BEARISH BREAKAWAY
The bearish breakaway is complicated since it is composed of five candle lines. Begin with an uptrend leading to the start of the candle. The first day should be a tall white candle. The second candle is another white one, but price gaps between its body and the prior candle’s body. The shadows can overlap, but the bodies shouldn’t. The middle candle can be any color, but it has a close that’s higher than the prior candle.
Line 4 is a white candle with a higher close. The final line in the pattern is a tall black one with a close that parks within the gap between the first two candle bodies. Again, ignore the shadows of the first two candles when looking for the gap. Since this is a five-line pattern with strict identification rules, a guess that it’s rare would be a good one. I found 36. Upward breakouts from those 36 in a bull market posted gains averaging 6.66%. It’s likely that additional samples will cut into that gain, so keep that in mind.
CONCEALING BABY SWALLOW
The concealing baby swallow is another rare candle pattern. If you want to search for one, begin with a downward price trend. The first two candles are black marubozu ones, meaning they don’t have any shadows. The third line is another black candle with a tall upper shadow. The candle gaps open downward and it trades into the body of the prior day, like that shown in Figure 1. The last candle in the pattern is another black one that completely spans (engulfs in candlespeak) the prior candle, including the shadows.
Suggested Books and Courses About Candlestick Patterns
I found just four concealing baby swallows in the 4.7 million lines searched, but the one with an upward breakout in a bull market did well. The gain averaged 5.92%. This candle pattern also doubles for one of the five top- performing candles with downward breakouts, so I count it twice. Downward breakouts show losses averaging 7.10%, placing it third on that list.
IDENTICAL THREE CROWS
Rounding out the top five is the identical three crows pattern, but it should not be confused with the three black crows. For the identical variety, look for the candle pattern in a rising price trend. Then find three tall black candles with the last two openings at or near the prior candle’s close. I show an ideal example in Figure 1.
This candle is not as plentiful as three black crows. I found just 921 of them. Those that broke out upward in a bull market (178) gained an average of 5.67%. Most of the time this candle will break out downward, so it acts as a bearish reversal 79% of the time. An upward breakout would mean a bullish continuation.
DOWN BREAKOUTS: BEARISH THREE-LINE STRIKE
The following candlestick patterns do best after breaking out downward. The top performer is a bearish three-line strike candle, and I show an ideal example of it in Figure 2.
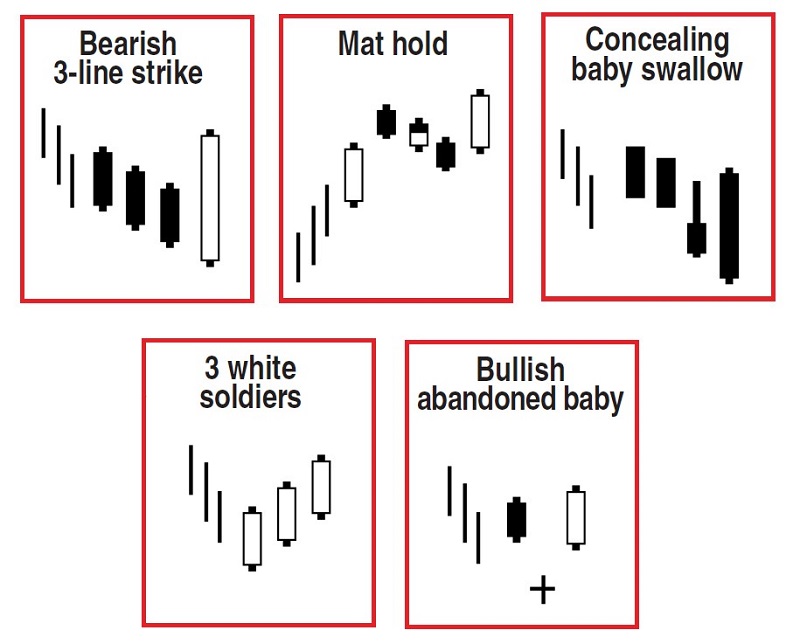
When I tested this pattern, I found that it acted as a bullish reversal 84% of the time instead of a bearish continuation as theory suggests. I base the interpretation on where price closes in relation to the candle. Since the candle closes near the top of the pattern, it is easier for an upward breakout (close above the highest line) to occur than a downward one (a close below the bottom of the pattern). If an upward breakout happens, then the candle acts as a bullish reversal. The bearish three-line strike is another rare candle. I found only 85 of them. Those with downward breakouts saw price drop an average of 8.81%. Again, that number is likely to change with additional samples.
MAT HOLD
In second place for performance is the mat hold with an average drop of 7.21%. This candle pattern looks a lot like a rising three-methods candlestick. The difference occurs with the gap on the second candle. In the mat hold, look for the pattern in a rising price trend. The first candle is a tall, white-bodied line. Bar 2 has price gapping open upward, but it closes lower. It is a small black candle that must remain above the prior close. Ignore the shadows when locating the gap.
The third line in the pattern can be any color, but line 4 is black. Both candles have small bodies with the closing price easing lower. The bodies must remain above the low posted by the first candle. The last line in the pattern is a white candle that closes above the highs of the prior four candles. It’s often a tall one but need not be. I think of the mat hold as a small version of a rise/retrace/rise pattern. In chart pattern–speak, it is a miniature measured move up.
THREE WHITE SOLDIERS
Three white soldiers is the complement of the three black crows pattern. Look for three tall white candles to appear in a downward price trend like that shown in Figure 2 by the thin price bars. Each candle line in the three white soldiers pattern must have a higher close and close near the high for the line. The last two candles must open within the body of the prior candle.
Downward breakouts from this candle pattern are one-fourth as frequent as those with upward breakouts. However, three white soldiers with downward moves drop an average of 6.41%. That’s quite tasty for a 10-day trip.
BULLISH ABANDONED BABY
The last candle pattern in the series is a bullish abandoned baby. It is another rare one, happening just 293 times in 4.7 million candle lines. Downward breakouts sport average losses of 6.04% measured 10 days after the candle ends. With additional samples, I would expect the performance to deteriorate, so keep that in mind.
For identification, look for the pattern to appear in a down-ward price trend. The first line is a black candle. The second one is a doji that gaps below the shadows of the two adjacent lines, like that shown in Figure 2. The final day is a white candle that gaps above the prior doji.
THAT’S A WRAP
So there you have it, five candle patterns that perform best after upward breakouts and five that perform best after downward breakouts. Unfortunately, many of the best performers are so rare that you are unlikely to encounter them in your normal trading. My guess is more samples will show that the rare candle patterns won’t perform as well as in lab tests. Thus, if you want to trade these candle patterns, then stick with the three crows, either black or identical, for upward breakouts, and the mat hold or three white soldiers for downward breakouts.
My previous article discussed the best reversal or continuation candles, and this one reviewed the best performance over 10 days. Can we combine those two features? What are the top reversal or continuation candlesticks that also lead to strong trends 10 days later? Answering those questions will be the subject of my next article.
Thomas Bulkowski is a private investor with 30 years of experience and considered to be a leading expert on chart patterns. He is the author of several books, the most recent of which is Encyclopedia Of Candlestick Charts. His free website and blog have more than 500 articles dedicated to price pattern research and is at www.thepatternsite.com.