Trading Articles
Three-Bar Inside Bar Pattern By Johnan Prathap
This trading strategy uses an inside bar as a three-bar pattern for long and short positions. Find out how it performed on gold, silver, and crude oil contracts. Whether you look at an intraday, daily, weekly, or monthly chart you will, without a doubt, see many inside bars. They appear in uptrends, downtrends, and sideways markets. Typically, most traders think of an inside bar as a two-bar pattern, but I have found successful trades using an inside bar pattern as a three-bar pattern for both long and short signals. An inside bar accompanied by higher closes indicates a short-term uptrend, and an inside bar accompanied by lower closes indicates a short-term downtrend. I tested this setup on daily data from May 2001 to August 2010 on three major commodities: gold (GC), silver (SI), and crude oil (CL). The results are worth some consideration.
THE INSIDE BAR
The typical inside bar two-bar view indicates minimal activity in a market. It is defined as a bar (or series of bars) that is completely within the range of the preceding bar; that is, it has a higher low and lower high than the bar immediately before it. Some traders consider a bar an inside bar if the high and low are equal to the previous bar or where there are several consecutive bars within the range of a previous bar. The “Inside Bar Show Me” study in TradeStation will not mark bars that meet either of these conditions. Many analysts tend to view inside bars as an indication of declining market activity, or possibly a prelude to a large movement in either direction.
TRADE RULES
- Three-bar inside bar pattern:
This pattern is divided into the following two categories:
- Three-bar inside bar positive reversal
- Three-bar inside bar negative reversal
If an inside bar formed inside two higher closes, then it is considered to be a three-bar inside bar positive reversal. If an inside bar formed inside two lower closes, then it is considered to be a three-bar inside bar negative reversal.
- Entry setup:
1) Three-bar positive inside bar is a: Higher close followed by an inside bar followed by a higher close.
- 1st bar setup: Close > Close[1]
- 2nd bar setup: High is lower than the previous bar’s high and its low is higher than the previous bar’s low
- 3rd bar setup: Close > Close[1]
When this three-bar setup forms, it is likely that the market will advance. This is a setup to go long the market.
2) Three-bar negative inside bar is a: Lower close followed by an inside bar followed by a lower close.
- 1st bar setup: Close < Close[1]
- 2nd bar setup: High is lower than the previous bar’s high and its low is higher than the previous bar’s low
- 3rd bar setup: Close < Close[1]
When this three-bar setup forms, it is likely that the market will decline. This is a setup to short the market.
- Exit setup:
The system exits at a stop-loss of 0.75% or a profit target of 0.75%.
- Exit a long position if current price ≥ entryprice + (entryprice * 0.0075), or exit a long position if current price ≤ entryprice–(entryprice * 0.0075)
The TradeStation code is provided in the “Easy-Language Code For Three-Bar Inside Bar.”
EXAMPLES
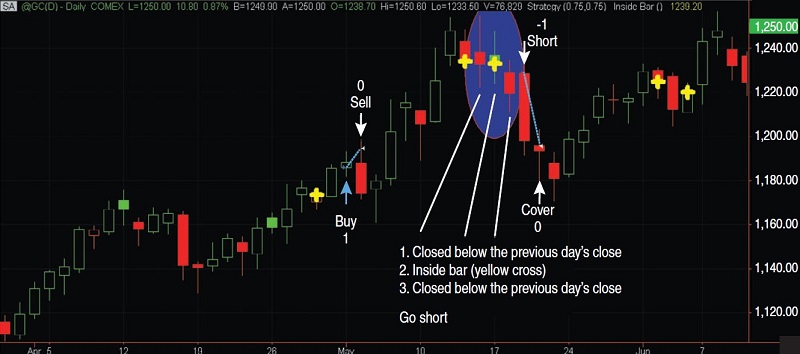
On the daily chart of gold (GC) in Figure 1, a setup formed on May 13, 2010, and an inside bar formed on May 14 and completed on May 17. The market closed below its previous close on May 13, followed by an inside bar on May 14, followed by a close that was below the previous day’s close on May 17. This turned out to be a profitable short-term short entry signal.
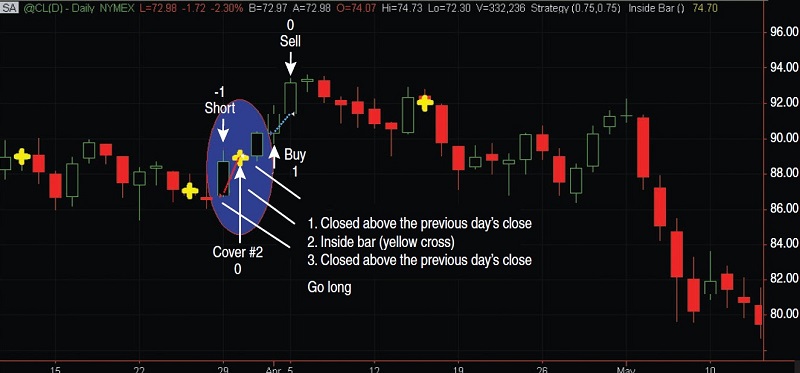
On the daily chart of crude oil (CL) in Figure 2, a setup formed on March 29, 2010, and an inside bar on March 30. The setup was completed on March 31. The market closed above its previous close on March 29, followed by an inside bar on March 30, followed by a close above the previous day’s close on March 31. This turned out to be a profitable short-term long entry signal.
Suggested Books and Courses About Chart Patterns


PERFORMANCE RESULTS
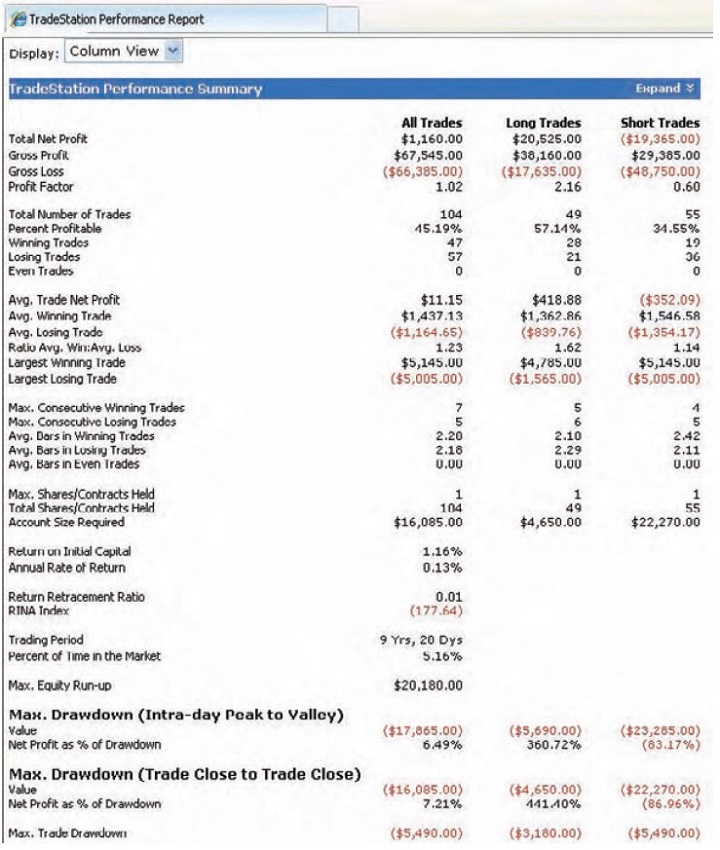
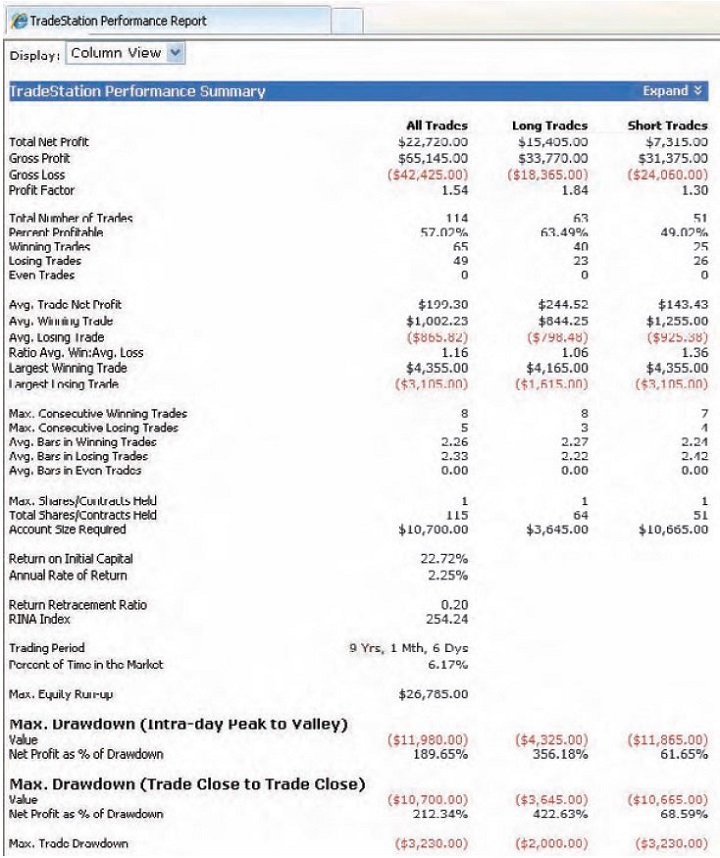
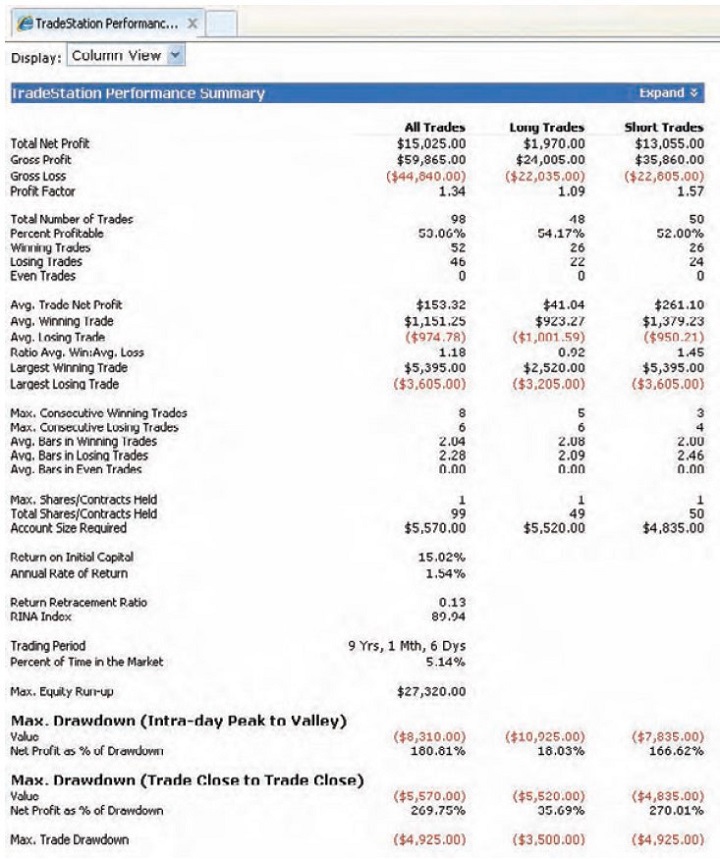
I tested this strategy for three commodities from May 2001 to August 2010. The system used daily price data and subtracted $2.50 in commissions per trade for one fixed share/contract. The results for crude oil (CL) were positive, with the best performance being from long trades (Figure 3). The method performed best in gold (Figure 4) and silver (Figure 5), gaining $22,720 and $15,025, respectively, with around 100 trades. Gold had an equity curve drawdown from November 2007 to September 2008. However, it regained quickly with no major draw-downs after that. The average net profit per trade for both gold and silver is more than $150.
IDEAS FOR FURTHER RESEARCH
This three-bar inside bar strategy tends to enter long or short dur-ing any type of trend. However, the system also tends to hold losing trades and profitable trades for the same percentage gain or loss. If you try using different types of exits such as trailing stops or average true range, it could result in higher profits. Crude oil performed well in long trades and silver performed well in short trades, so applying any filters in your entries could change your performance results. The drawdowns of initial capital of this system when trading gold and silver were only 10%. Crude oil, however, had a drawdown of 17%.