
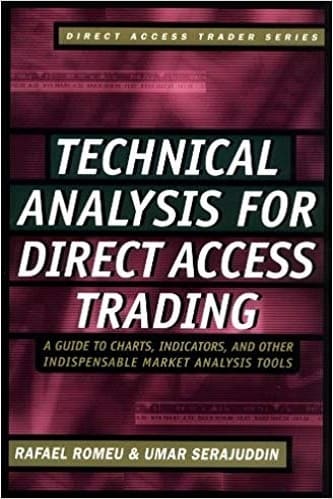
Technical Analysis for Direct Access Trading: A Guide to Charts, Indicators, and Other Indispensable Market Analysis Tools
$13.00
Technical Analysis for Direct Access Trading: A Guide to Charts, Indicators, and Other Indispensable Market Analysis Tools provides a structured introduction to technical analysis within the environment of electronic direct-access trading. Rafael Romeu and Umar Serajuddin explain how individual market participants can interpret price, volume, trends, and market behavior while using electronic access to observe and execute trades more directly.
The book develops technical analysis from its basic foundations into progressively more specialized methods. It begins with price-volume charts, support and resistance, market supply and demand, and the relationship between technical and fundamental analysis. Rather than presenting technical analysis as a guaranteed forecasting mechanism, the authors repeatedly frame it as evidence that can support an investment or trading decision while acknowledging uncertainty, interpretation, and the possibility of conflicting signals.
The analytical framework then expands into trend identification and classical chart formations, including head and shoulders, gaps, broadening formations, double and triple tops and bottoms, saucers, rounded tops, triangles, flags, pennants, and wedges. Dow Theory is examined as a framework for understanding primary, secondary, and minor trends, confirmation between market averages, and the relationship between trading volume and the primary market trend.
Later chapters cover moving averages, Bollinger Bands, momentum, rate of change, advance-decline analysis, relative strength, accumulation-distribution, on-balance volume, MACD, and the Arms Index. A substantial chapter also introduces Elliott Wave Theory, Fibonacci relationships, impulsive and corrective waves, alternation, channeling, volume confirmation, wave ratios, and timing. Throughout, the authors emphasize combining evidence rather than relying mechanically on a single indicator or theory.
The book is positioned as an accessible introduction for self-directed investors and active traders who want to understand both the reasoning behind technical tools and their application in a direct-access market environment. Its discussion of Nasdaq Level II access, electronic trading systems, and early direct-access technology reflects the market structure of its 2001 publication period, while its central analytical material focuses on established technical-analysis principles.
✅ What You’ll Learn
- Interpret price and volume charts as evidence of changing market supply and demand.
- Identify support and resistance levels and understand their role in potential market turning points.
- Compare technical analysis, fundamental analysis, and the efficient-market hypothesis.
- Recognize trend direction and distinguish between reversal and continuation formations.
- Analyze major chart formations including head and shoulders, gaps, triangles, flags, pennants, wedges, and multiple tops and bottoms.
- Apply Dow Theory concepts involving primary, secondary, and minor trends, confirmation, and volume.
- Use moving averages, weighted moving averages, envelopes, and Bollinger Bands to evaluate market direction.
- Interpret momentum tools including rate of change, relative strength, MACD, on-balance volume, accumulation-distribution, and the Arms Index.
- Understand the structure of Elliott Wave Theory, including impulsive and corrective waves, Fibonacci relationships, channeling, and wave ratios.
- Combine multiple forms of technical evidence rather than treating individual indicators as independent buy or sell signals.
💡 Key Benefits
- Builds technical-analysis knowledge systematically from basic price and volume concepts through advanced chart and wave analysis.
- Explains the reasoning behind technical indicators instead of presenting them only as mechanical formulas or trading signals.
- Provides a balanced treatment of technical analysis by examining its limitations alongside competing market theories.
- Connects chart interpretation with direct-access trading, market liquidity, execution, and real-time market observation.
- Develops a multi-signal approach in which trends, patterns, momentum, volume, and other evidence can be evaluated together.
- Provides exposure to several major schools of technical thought within a single structured framework.
👤 Who This Book Is For
- Beginner to intermediate traders seeking a structured introduction to technical analysis.
- Active stock traders interested in applying chart analysis within direct-access and short-term trading environments.
- Self-directed investors who want to understand support, resistance, trends, patterns, moving averages, and momentum indicators.
- Traders progressing toward more specialized methodologies such as Dow Theory and Elliott Wave analysis.
📚 Table of Contents
- Technical Analysis Basics
- Technical versus Fundamental Analysis
- Price Formations and Pattern Completion
- The Dow Theory
- Moving Averages, Momentum, and Market Swings
- Elliott Wave Theory
Technical Analysis for Direct Access Trading: A Guide to Charts, Indicators, and Other Indispensable Market Analysis Tools By Rafael Romeu
| Author(s) | |
|---|---|
| Product Type | Ebook |
| Format | |
| Skill Level | Beginner to Intermediate |
| Pages | 231 |
| Publication Year | 2001 |
| Delivery | Instant Download |
3 reviews for Technical Analysis for Direct Access Trading: A Guide to Charts, Indicators, and Other Indispensable Market Analysis Tools
Only logged in customers who have purchased this product may leave a review.
Related products






Chana Portillo (verified owner) –
A great example of its kind — I’ve read several books looking for one both knowledgeble and entertaining and this certainly fits the bill. If you are trying to do research or learn more about the practice of trading, this is very helpful. It presents a comprehensive (and comprehensible) guide to the world of direct access trading. Good job!
Wallace Shelton (verified owner) –
I tried very hard not to be predisposed against this book just because it was written by two academics. But once I started reading, it was impossible to ignore the fact that this title reads like a bad college textbook. The worst section here is that on moving averages, which suggests how to identify trends by deriving some equations related to the moving averages. This is complete with fancy looking formulas with epsilons and everything, and yet after all that no useful trading recommendations whatsoever are suggested. “For example, the technician will use a rule that if the price falls 10% below the moving average, it probably is not a whipsaw”. This is a totally ridiculous commentary for trading at any time frame.
The reason my rating goes beyond just plain bad and into 1 star territory is that, in addition to providing negligable trading advice throughout, there were two sections that gave recommendations that are entirely the opposite of correct. In the section on support and resistance, the authors advocate selling at resistance points, and suggest that one will go broke if you always buy at resistance and sell at support. This is completely wrong; really great stocks will hover at resistance and then blow right through it on the upside, while poor stocks will linger around support for a while and then crash right through it hard. Buying at support and selling at resistance will put you on the wrong end of both of these. Read about the strategies of a great trader like Jesse Livermore to learn the right way to do things, which is to buy at the top end of the resistance point as the stocks breaks out and then sell it if falls to support.
Second example: “Say the CEO of Coke died in a plane crash along with the formula. Coke stock would plummet, right? But technical analysis would not pick that up”. This shows the authors have a basic misunderstanding of TA: of course it would pick this up. You’d get a clear as could be gap down followed by a downward breakout in this sort of situation, a kindergarten market technician could tell you something bad had happened and that you should sell via the chart without even hearing the news. That’s the basic premise behind technical analysis, and the fact that the authors don’t even understand that fits right in with the rest of this dissapointing book.
Stephen Stout (verified owner) –
It explain well the relationship between price and volume, but I expected more discussion on the technical indicators like stochastics, MACD, Williams %R,RSI, OBV ect… It doesn’t cover well time frame that has to be used when reading technical indicators. And it doesn’t show you how to combine the diferents indicators.