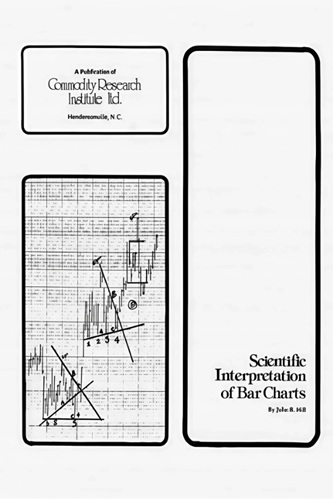
Scientific Interpretation of Bar Charts
$18.71
Originally published in 1979 by the Commodity Research Institute, Scientific Interpretation of Bar Charts remains one of the most methodical and technically precise studies ever written on the behavior of price bars in commodity markets. John R. Hill — a veteran trader and engineer — dissects every element of bar-by-bar action, from daily overlaps and intersections to scalping tactics and wave structures, revealing the inner logic of market psychology as expressed in price movement.
Unlike generic charting manuals, this volume is written by a trader who personally tested each observation through years of practical trading. Hill’s engineering mindset transforms the art of tape reading into a structured analytical process — a blueprint for decoding market supply and demand in real time. Each chapter builds from foundational daily bar concepts to advanced methods like the Four-Day-Close and Trendline Break system, turning raw market data into actionable, rule-based decisions.
✅ What You’ll Learn:
- The precise interpretation of individual bars: hooks, inside days, one-day reactions, and overlap theory.
- How to read the law of supply and demand directly from chart action — with more than 80 real-market examples.
- Advanced tools including the Two-Day Intersection, Daily Overlap, and Labored Move theories.
- How to detect trend changes early using spring and upthrust formations.
- The mechanics of day-trade scalping, swing trading, and daily tape reading for professional execution.
- Practical wave and trendline analysis for forecasting continuation or reversal setups.
💡 Key Benefits:
- A scientifically structured approach to bar chart interpretation — decades ahead of its time.
- Integrates psychology, structure, and market energy into one cohesive trading method.
- Applicable across commodities, futures, and equities.
- Includes quantitative techniques for intraday traders and discretionary swing traders alike.
- Teaches you to think like a professional chart analyst — not merely follow signals.
👤 Who This Book Is For:
This book is intended for intermediate to advanced traders who already understand basic charting and want to master the scientific side of bar analysis. It is particularly valuable for traders who rely on discretionary setups, price structure recognition, or tape reading to anticipate market behavior.
📚 Table of Contents:
- Daily Bar Chart Analysis
- Chart Action
- Trendline Theory
- How to Detect a Trend Change
- Daily Overlap Theory
- Two Day Intersection Theory
- Trading Running Markets
- Day Trade Scalping Rules
- Daily Tape Reading Techniques
- Actual Market Action Analysis
- Wave Analysis of Soybeans
- Four Day Close & Trendline Break
Scientific Interpretation of Bar Charts By John R. Hill
| Author(s) | |
|---|---|
| Product Type | Ebook |
| Format | |
| Skill Level | Intermediate to Advanced |
| Pages | 70 |
| Publication Year | 1979 |
| Delivery | Instant Download |
3 reviews for Scientific Interpretation of Bar Charts
Only logged in customers who have purchased this product may leave a review.
Related products

Siena Powers (verified owner) –
This is a great book on how to read naked bar charts with no indicators. A small example of a price action is shown and a quick description follows and the price action and its significance is explained. Short and sweet. This is one of the few books I have ever seen that explains individual bars in the context of a larger picture. I stumbled on a torn copy of this book at a second hand book store, it was a lucky find.
Leo Wilkinson (verified owner) –
This book (well, it’s only 60 pages) is chocked full of chart patterns and the authors explanations of some of the more popular techniques. I am more of a swing trader so the time frame studied is a bit short for me. The book is valuable in many ways if only for the pattern recognition.
Sean Fitzgerald (verified owner) –
Recommended to me by a retired professional, this is a really helpful study made back in the 70’s on daily commodities movements. Still very applicable today, regardless of timeframe or instrument. If you take the time to study this paper you will be much better for it.