Trading Articles
Gap Fill And Go By Jamie Theiss

Here’s a look at two trades using a strategy you can use almost every day. I’m going to show you two trades using a bread & butter strategy you can use almost every day to capture profits from the stock market. As you can see from Figures 1 and 2, I use candlesticks and moving averages on a five-minute time frame. I use the eight- and 21-period simple moving averages (SMA), which are displayed in green and blue, respectively, along with the 200-period SMA (red). Of course, eight and 21 are Fibonacci numbers. In addition, the 200-day SMA is watched by so many that it has practically become self-fulfilling. I call the technique the “gap fill and go.”
THE SETUP
To set up these trades, please observe that the eight- and 21-pe-riod SMAs are in an uptrend on the five-minute chart. While not shown, the SMAs are also in an uptrend on the higher time frame charts, such as the 15-minute and 60-minute charts. Next, we have a bullish gap up on the opening bell. Now the hardest part of the trade is sitting on your hands for the first 30 minutes of trading. You want to just sit and observe. Then, you may begin to notice the gaps are starting to fill. This is just a version of the well-tested slogan, “Buy the dips and sell the rallies.” You are just waiting for the dip to occur in the predetermined uptrend.
THE FAS TRADE
In the Direxion Daily Financial Bull 3X Shares exchange traded fund (FAS) trade in Figure 1, you are waiting for the first green bar to take out a red bar. This will usually happen during the 10:00 am reaction time. This could be anywhere from 9:50 am to 10:10 am. The fourth red bar’s highest price is just below $30.20, so you want to buy one cent over that red bar, or $30.21, and place your protective stop one cent below the entry bar, which is $29.98. I don’t wait for the bar to close and take the entry as soon as the previous bar’s high is taken out. The current low of the not-yet-closed entry bar is what the stop would be. If that low is broken, then the reason for the trade is over. That gives you a 23-cent risk for this trade. It is critical you share-size correctly for the risk amount. For example, if your risk per trade is $100, using a risk of 23 cents gives you a share size of 435 [100/$0.23 = 435]. It is wise to average down to 400 shares to account for slippage and transaction costs, and to keep you from using odd lots.
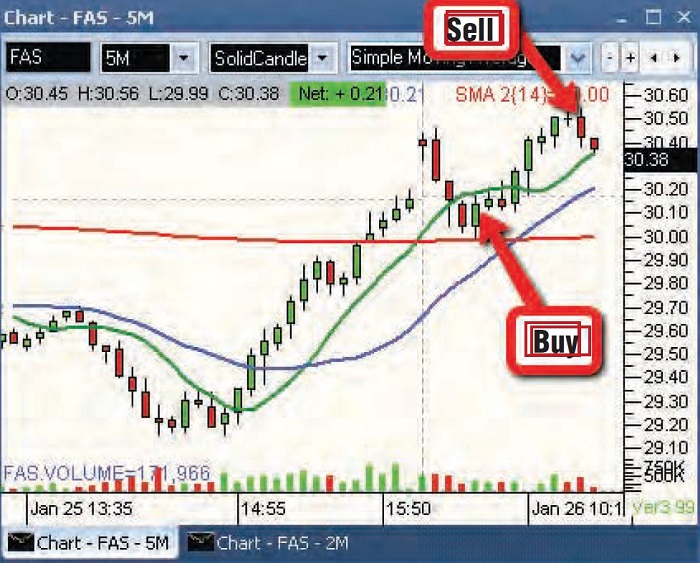
In addition, I hope you noticed how the flat 200-period SMA (red) acted as a floor of support for the price movement. It is almost as if by magic. To recap, we have a reversal bar off the flat 200-period SMA with rising eight- and 21-period SMAs, at the 10 am reaction time. We’ve identified a potential winning trade, calculated the risk, determined share size, and placed our protective stop. Now we sit on our hands again and let our edge play itself out, and wait for our profit-taking plan to activate.
While there are many ways to trail the price and take profits, for this method I will use a five-minute bar-by-bar trail method. But first I have to be willing to let the trade breathe a bit and let my edge play out. I am going to wait until I have two consecutive bars of profitability. Only then will I move my stop to breakeven and start the bar-by-bar break count.
Looking at the FAS chart, you can see the first bar break is after the little doji bar. That narrow range bar is only high $30.55/low $30.48, so I would exit the trade as soon as $30.47 prints in the time & sales window. My entry was at $30.21 and I am flat at $30.47, which leaves a profit of 26 cents on 400 shares, or $104. It is not the most profitable trade at only a 1:1 risk-reward ratio, but it is a profit, nonetheless.
Suggested Books and Courses About Chart Patterns


THE NTAP TRADE
In Figure 2, the setup is almost the same as with FAS. The SMAs are rising on the five-, 15-, and 60-minute charts. NetApp Inc. (NTAP) showed some strength on the first two five-minute bars but pulled back with the rest of the market to fill the gap by the 10:00 am reaction time. Again, I am looking for a green bar to take out a red bar.
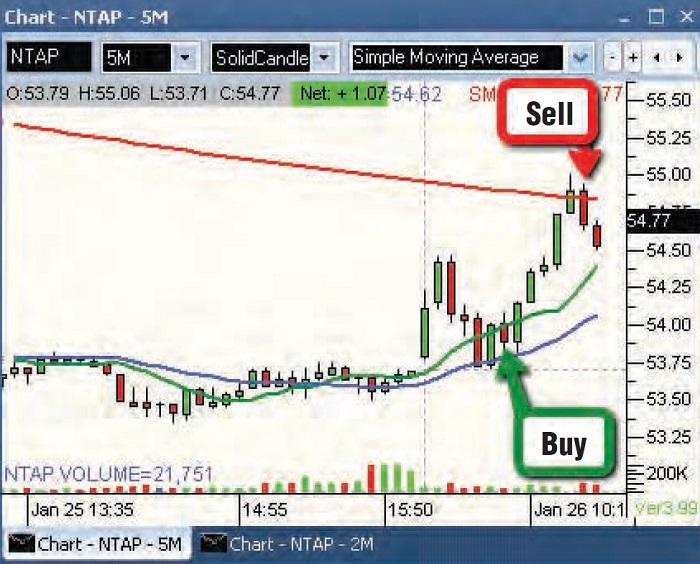
The entry price triggered at $54.03, but the spread and slip-page got my cost to $54.05. The low of that big red bar at the pivot on the 20-period SMA is $53.71, so my stop will be at $53.70. That gives me a 33-cent risk, and using the $100 risk per trade example, a share size of 300. Wait for two consecutive bars of profitability before moving your stop to breakeven.
One difference in this trade is that the 200-period SMA is overhead and giving you a price target. This price target is almost at $55.00, which, being a whole number, is another obvious target price. Because of this, I will need to manage the profit taking a little differently. I want to set a take-profit order on 200 shares just below $55, which is also a test of the overhead 200-period SMA resistance area. If it does not get there, I will still use the bar-by-bar break to get out. In addition, I will trail my remaining 100 shares on a bar-by-bar break if the take-profit order is hit. I want to leave some shares on, just in case there is a big run to the upside.
Just like the previous trade, I have identified a potential winning trade. There is a reversal bar off the rising 20-period SMA, at the 10:00 am reaction time. I have identified my risk of 33 cents, share-sized correctly, and put my protective stop in place. Now I have to let my edge play out.
It gets a little dicey when the rising 20-period SMA is retested on the very next bar, but it soon takes off and goes right to the 200-period SMA. It tested the resistance point of the overhead 200-period SMA and went as high as $55.02. My take-profit order at $54.98 is taken out and my remaining 100 shares are sold when the five-minute bar is broken at $54.74. With my cost being $54.05, I have a profit of 93 cents on 200 shares and 69 cents on the last 100 shares. That gives me a $255 profit on the NTAP trade. This is a much more respectable 2.5:1 risk-reward ratio. Add the $104 from the FAS trade, and I have a total of $359 for the first hour of the trading day. I’m probably done for the day unless I see something so extraordinary that I can’t stand not to take it. But even then I will probably cut my risk in half and share-size accordingly.
What I’ve showed you here is something that happens almost every day. And in case you are wondering, it works just as well on the short side, maybe even better, since fear is more powerful than greed and the price usually drops faster than it goes up. For the short trades, all you have to do is the converse. The SMAs should be declining and you should get a bearish gap down.
Some of the key points to remember are rising SMAs on the five-, 15-, and 60-minute charts for long positions. You are buying the dips on a confirmed uptrend. On the short side, you are selling the rallies on a confirmed downtrend. Wait for the green bar to take out a red bar at a moving average at the 10 am reversal time. You have a reversal bar, at the reversal time, on a moving average line. Identify your risk and share size correctly to your risk amount. Set your stop one cent below the entry bar or the pivot bar, whichever is lower, then sit back and let your edge play out. After two consecutive bars of profit, move your stop to breakeven. Take profits using the bar-by-bar break or other well-defined price target. Happy trading!
Jamie Theiss is a full-time trader who daytrades stocks, swing trades forex, and from time to time position trades commodities.