Trading Articles
Three Peaks And A Domed House By Ed Carlson

Predicting and timing the tops of bull markets — both cyclical and secular — can be accomplished using this well-known pattern developed by George Lindsay. Despite 25 years of newsletters, the methods of George Lindsay have always been a bit of a mystery. Appearances on the television program Wall $treet Week With Louis Rukeyser in the 1980s, numerous references in The New York Times during the 1960s and 1970s, and 10 years of performance tracking by Stock Trader’s Almanac have not been enough to offset Lindsay’s failure to write a book describing his unique but prescient methodologies. Everything we know about his work is from the scattered collection of the remaining newsletters we were able to recover.
THE PATTERN
Probably the best-known concept Lindsay developed is the three peaks and a domed house (3PDh). A fairly simple yet powerful geometric pattern, the 3PDh formation has an admirable track record for both predicting and timing the tops of bull markets — both cyclical and secular. Many traders and analysts use this pattern in isolation, as it is often effective as a standalone forecasting tool.
George Lindsay, however, saw this model as a tool to be integrated with his other, less-known models. We saw in April 2011 how using the 3PDh pattern in isolation caused some grief among traders when many using the pattern saw it pointing to a final top to the March 2009 bull market. If those traders had been aware of how the 3PDh formation fit into Lindsay’s other models, they would not have made that mistake, as any April target date they had derived from the model had clearly been eliminated by those other models.
I will share with you what those analysts saw and then explain how those more familiar with Lindsay’s work knew the April target to be incorrect. In the process, I will show how some of Lindsay’s models can be used to determine a target date for a final high to the bull market. Let’s start by showing what most analysts saw and review the basics of the 3PDh pattern for those unfamiliar with it.
THE BASICS
You can clearly see the three peaks (as labeled) on the left side of Figure 1. The distance between peaks 1 and 3 meet Lindsay’s minimum measurement of six months; typically eight months but no longer than 10 and no shorter than six. Peak 3 is then followed by the separating decline. This is a three-wave decline (down/up/down), which declines to a level lower than one or both of the retracements following peaks 1 and 2. We can count wave 1 down as ended on the May 6, 2010, flash crash followed by a bounce into May 12, and the final drop into either May 25 or June 8. Some might even count the final drop into July 2 as the bottom of the separating decline.
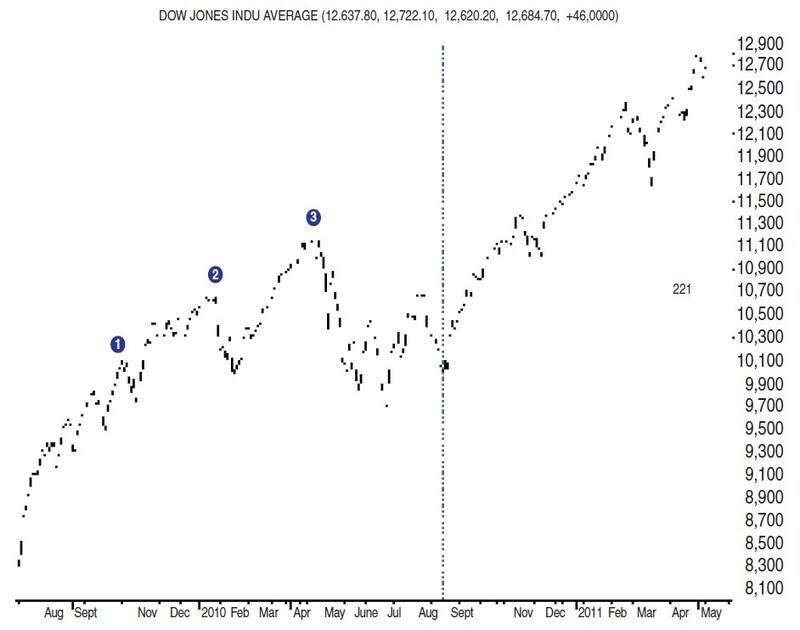
It is at this point that most analysts started to project a final date for the bull market. Lindsay wrote that the standard count to the top of the bull market was seven months and 10 days (221 to 224 days). Determining the origin of the count is always the tricky part. Lindsay explained that before the next sustained advance (the first floor wall) can occur, a base must be built. The base consists of two tests of the bottom. In the case of a symmetrical base (it is debatable whether the June–August 2010 base was symmetrical), we count from the second test.
Most analysts seem to have chosen August 26 as the date of the second test. That date probably stems not from their determination of whether it was a symmetrical base or which test of the bottom it might have been, but because it was the last test prior to the sustained uptrend (first floor wall) that followed. Counting forward 221 to 224 days from August 26 gave a targeted top to the bull market somewhere near the period of April 4–7, 2011.
LONG-TERM INTERVALS
Rather than starting and stopping with the three-peaks formation, the first step in using Lindsay’s work (to find the correct address of a bull market top) is to find the right “zip code.” This is done using the long-term intervals: 15 years from an important low to a high and 12 years from an important high to a low. Long-term intervals can cover a span of time ranging from 15 years to 15 years, 11 months.
Lindsay used a rule of thumb of 15 years, two months to begin his search. While there is not enough space here to explain why, July 23, 1996, is the correct origin of the current interval. If you count 15 years, two months from that, it counts to September 2011, and 15 years even to July 2011 is quite possible. Anything less, while not impossible, is improbable. The result? The target derived from the three-peaks formation (April 4–7) was too early. We now find ourselves in what Lindsay called a sideways movement.
SIDEWAYS MOVEMENT
Occasionally, an advance ends at the appointed time but there is an interim period before the next decline sets in. This is an intervening period when the theoretical trend is neither up nor down. Lindsay called the market action during this theoretically neutral period a sideways movement. During this time period, the overall result of price movement is approximately sideways, regardless of what price may do in the interim. A sideways movement may be thought of as a pause in the action while the market is regrouping for the next sustained trend.
A sideways movement starts with a break, a rather sharp one in nearly every case. Then there is a recovery to the approximate level of the old high. Sometimes the average falls short of the high and sometimes it exceeds it. This is not important. Eleven months has been the maximum duration of sideways movements.
Lindsay wrote that since 1842, there have been 40 basic advances. Of these, 31 were followed by recognizable basic declines and five were followed by sideways movements. The shortest sideways movement on record is 118 days: 118 days between highs in the sideways formation, and 118 days from the February 18, 2011, high (determined by standard time spans, discussed in the next section) is June 16, 2011, a date nowhere near a high. While the final high of a sideways movement need not be the ultimate high of the preceding bull market, the succeeding bear market will not start in earnest until the final high is printed.
BASIC MOVEMENTS
The targeted time period of April 4–7 made perfect sense — when using the 3PDh in isolation. Knowledge of Lindsay’s concepts of long-term intervals and basic movements, however, would have avoided the mistake we can now see with 20/20 hindsight. Lindsay wrote of basic movements: basic advances and basic declines. He categorized the different movements into categories he called standard time spans — irregular, short, long, and extended. These are time spans that have occurred time and again throughout history. The first step in counting a time span is in determining the point from which to count. He wrote that following a bull market top, a bottom — temporary or final — almost always occurs 13 to 14 months later.
This is a long basic decline of approximately 400 days. Following the October 2007 top, a temporary bottom developed 13 months later in November 2008, just like clockwork (see Figure 2). Lindsay’s rule of continuity states when a downtrend ends — either a basic decline or a long-term interval — an uptrend of the same class must begin immediately, and vice versa. Consequently, it is from the November 2008 low (and not the March 2009 low) that we begin counting the next basic advance.
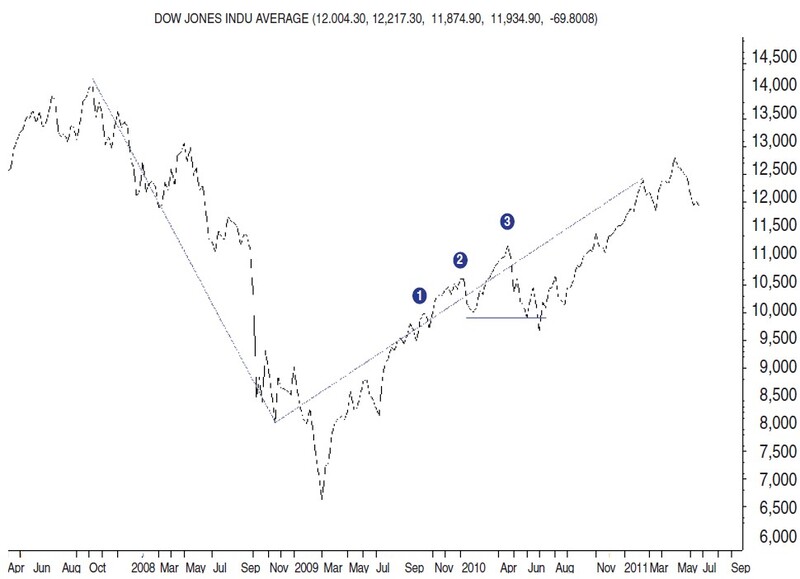
That the bear market did not end until March 2009 makes no difference to Lindsay’s counting process. Counting from the November 2008 low to the February 2011 top counts 820 days and fits into the standard time span of a basic long advance.
Suggested Books and Courses About Chart Patterns


FUTURE LONG-TERM INTERVALS
George Lindsay wrote that the longest sideways movement is 11 months. Counting from the February 18, 2011, high (the end of the basic long advance) means the final high needs to be printed no later than January 18, 2012, but we can narrow this down even more. The process of finding a high is often helped by looking for the next low. Counting from the January 14, 2000, high, we estimate the next 12-year low to fall somewhere between March 14, 2012 (12 years, two months), and September 14, 2012 (12 years, eight months). The previous decline (October 2007–November 2008) was a long decline, so we will expect a short decline (due to the principle of alternation) after the upcoming 2011 top.
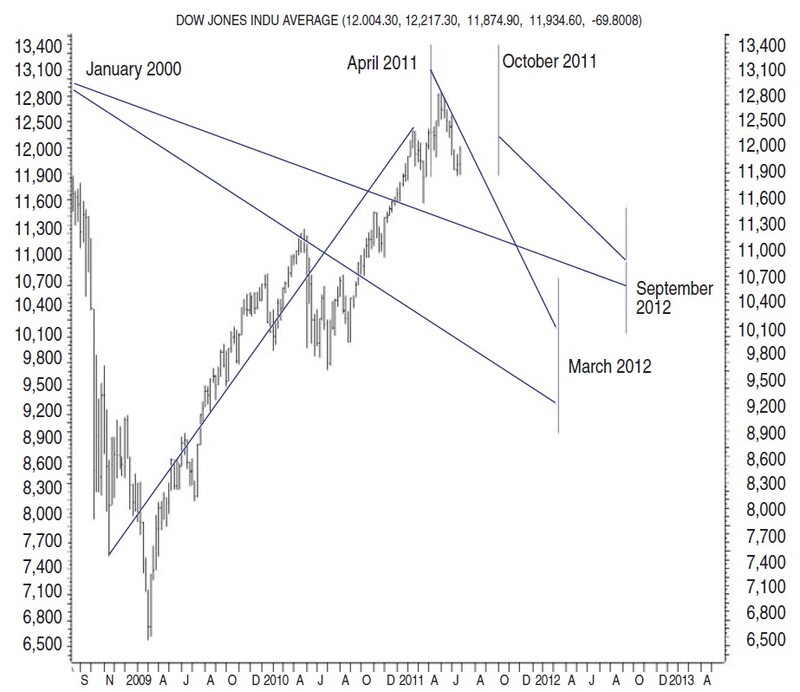
Looking at the standard time spans, we see that a short basic decline is approximately 345 days. So, counting backward to target the 2011 top, we find that March 14, 2012, minus 345 days equals April 4, 2011. September 14, 2012, minus 345 days equals October 5, 2011. Based on this, the top should fall between April 4, 2011, and October 5, 2011 (see Figure 3).
LINDSAY TIMING MODEL
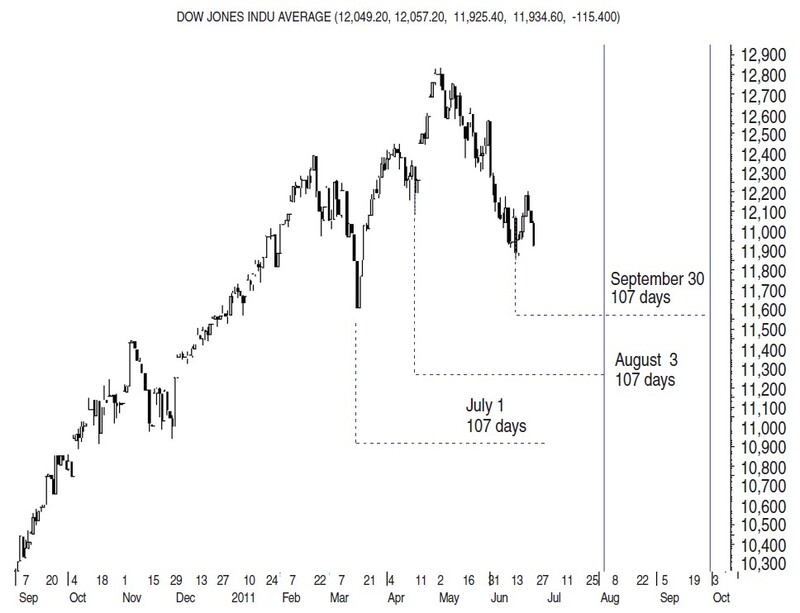
A final method of narrowing down the targets to specific dates is the Lindsay timing model, also referred to as the top-to-top model or the 107-day interval model. Again, space precludes an in-depth explanation of the model. Near or prior to the most likely final date of the sideways movement, October 5, 2011, we can identify three 107-day interval counts: July 1, August 3, and September 30 (Figure 4). All dates are confirmed with both important and minor low-to-low-to-high intervals; 107-day intervals assume a five-day window surrounding the target date.
George Lindsay’s methods have done a remarkable job of forecasting, not only bull and bear market tops and bottoms, but the twists and turns within those markets throughout the year. During the late 1960s and 1970s, Lindsay predicted the highs and lows of the Dow Jones Industrial Average throughout each year, with surprising accuracy more than a year in advance. Stock Trader’s Almanac called his 1969 annual forecast “the finest we have ever seen.”
Ed Carlson, CMT, an independent trader and consultant, is the author of George Lindsay And the Art Of Technical Analysis. He hosts The MTA Podcast Series: Conversations and manages the website SeattleTechnical Advisors.com. He spent 20 years as a stockbroker and holds a master’s degree in business administration from Wichita State University.