Trading Articles
Momentum Reversal Analysis and Price Forecasting: A Method by Devin Sage
Spotting a reversal in the current momentum of the market and forecasting its price movement is every trader’s objective. Here’s a look at the X-sequentials X7 pattern, a technique that has been applied to the DAX futures, NASDAQ 100, and mini–crude oil contracts. Daily financial market transactions based on news, fundamental data, and emotional decisions are reflected in prices as momentum. Momentum has direction and magnitude and can be seen on a chart in the form of uptrends, downtrends, countermoves, and trading ranges. The nice thing is that when you can identify a reversal in the current momentum of the market, there is a method with which you can derive price forecasts. Here’s how you can spot a reversal in the current momentum of the market and derive a forecast by applying the X-sequentials X7 pattern, forecasts based upon measured momentum reversals.
THE X-SEQUENTIALS X7 PATTERN
To apply the X-sequentials analysis, you need to use a bar chart with swing lows and swing highs identified. These swing highs and lows will enable you to draw the two lines necessary to apply the X7 pattern. These two lines are the base line and price line. To locate an X-sequentials X7 pattern, first you have to sum up seven market moves. This will allow you to draw the base line. The base line is mandatory to locate the primary characteristic of this pattern: the momentum reversal. The diagram in Figure 1 describes the principle of a bearish X-sequentials momentum reversal.
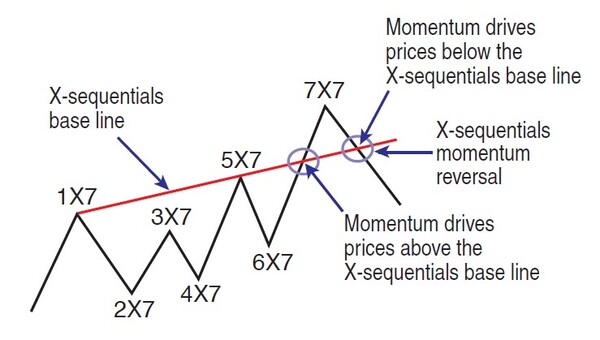
Bearish X-sequentials momentum reversal
Since an X-sequentials X7 pattern consists of seven market swings, you need to search for two highs with a lower high in between on your chart. You can then draw the X-sequentials base line by connecting the two highs and extending it to the right side of the chart. The first high is marked as “1X7” and the second high as “5X7.” The lower high is termed as “3X7.” The low, “4X7,” can be higher or lower than the low “2X7.” After the “6X7” downleg, the market’s momentum must drive prices above the base line.
If the current market momentum breaks the base line down-ward, you can label the last high as “7X7.” The break of the base line downward indicates an X-sequentials momentum reversal and a complete X7 pattern. This makes it possible to derive the upcoming move’s price potential to the downside. Figure 2 shows how you can derive a price forecast after the X-sequentials momentum reversal has taken place.
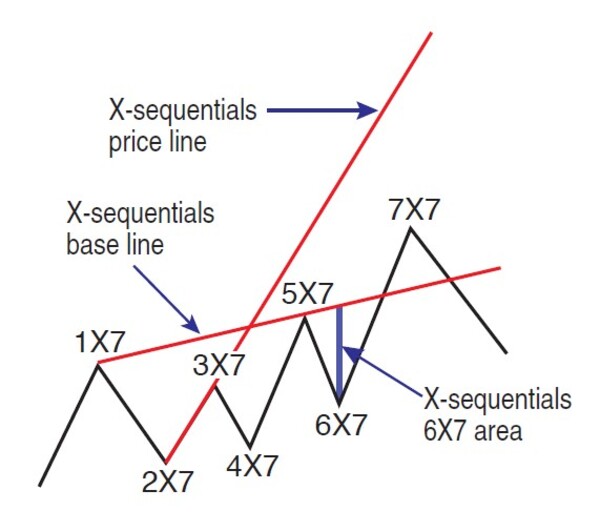
Forecasting price
An X-sequentials momentum reversal indicates a turn in the market’s current direction. To derive the price target of the new market move, you draw a line connecting the low of 2X7 with the high of 3X7 and extend the line relative to the high of 7X7. This line is the X-sequentials price line. This price line can only be drawn after the momentum reversal has taken place.
You then measure the distance from the low of 6X7 to the base line. This is the 6X7 area. The 6X7 area is necessary to optimize the price projection. In Figure 3 you can see how to derive the price target.
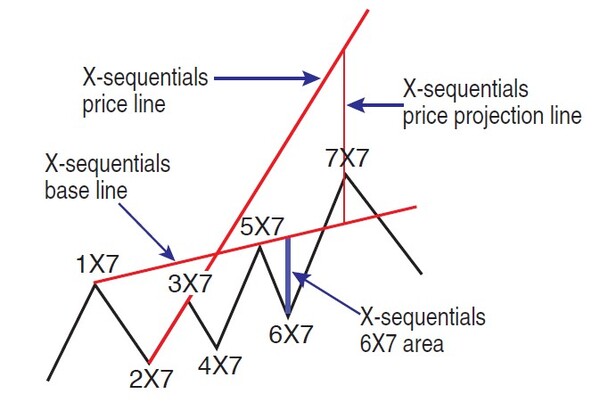
Deriving the price target
The price forecast is derived by drawing a vertical line that connects the base line with the price line through the high of 7X7. This gives you the price projection line. To summarize, you identify a momentum reversal using the base line. You then connect it with the price line and measure the potential of the momentum in a counterdirection. Figure 4 shows how you can project the price target of the down move after a momentum reversal takes place.
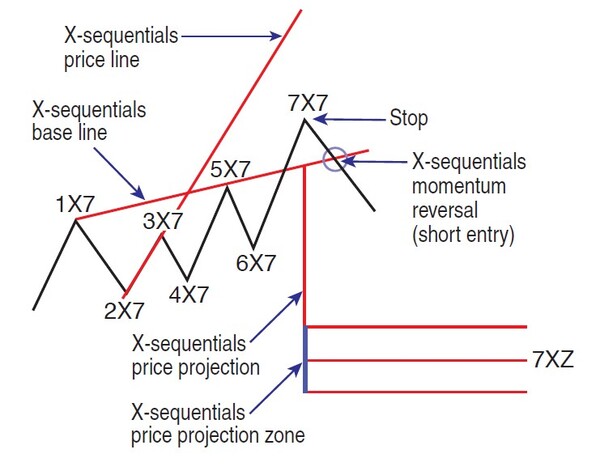
Projecting price target of down move
The X-sequentials price projection line is a symmetrical move of the projection line at the base line. You then extend the price projection with the 6X7 area. In some cases, the 6X7 area has to be subtracted from the price projection. The center of the 6X7 area has to be marked with a line. This gives you the price projection zone, which is the area where prices are likely to move to.
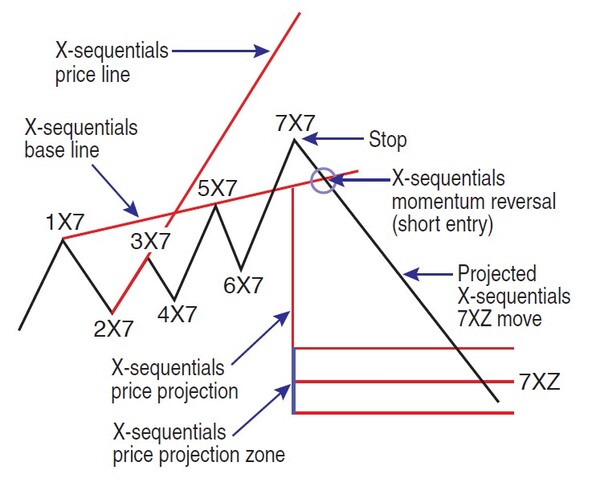
The momentum reversal is also your short entry signal. You would set your initial stop at the high of 7X7. You have now projected the price target zone for the down move after a momentum reversal has taken place. This projected down move is referred to as “7XZ.” Figure 5 depicts how the down move to 7XZ unfolds into the projected area. Now, let us look at X-sequentials X7 pattern examples starting with the German DAX continuous futures.
DAX FUTURES
The DAX continuous futures formed a bearish X-sequentials X7 pattern from December 21, 2010, to February 21, 2011 (Figure 6). To locate an X-sequentials X7 pattern, you only have to have two highs with a lower high in between to draw the base line. In addition, the following market swing should form an X-sequentials momentum reversal.
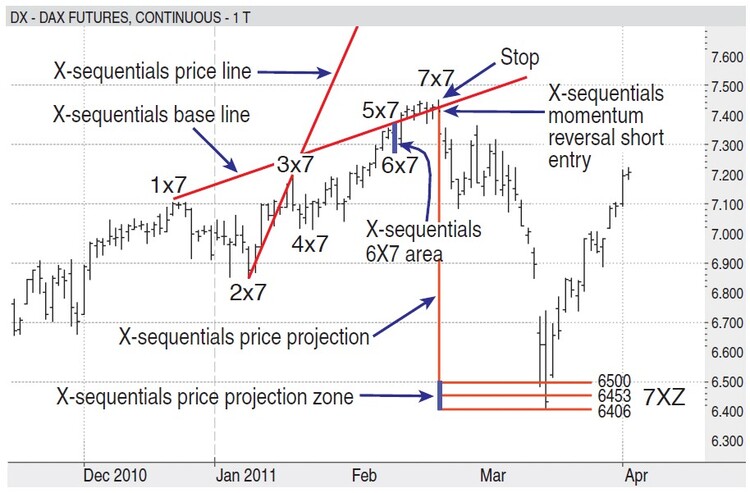
Using the methodology described previously, you can draw your X-sequentials price and base lines. You can also calculate your price projection line. You then use this projection line to determine your price projection.
The next step is to add the 6X7 area to the price projection, giving you the price projection zone. The momentum reversal indicated a down move with a price target from 6500 points to 6406. The DAX continuous futures reached the price projection zone, after which it reversed upward. This down move is the X-sequentials move 7XZ.
Let us now look at Figure 7. The NASDAQ 100 index formed a bearish X-sequentials X7 pattern from January 19 to February 16, 2011. The momentum reversal indicated a down move with a price target from 2210 points to 2189 points. Here again, the 3X7 high is lower than the 1X7 high and the 5X7 high.
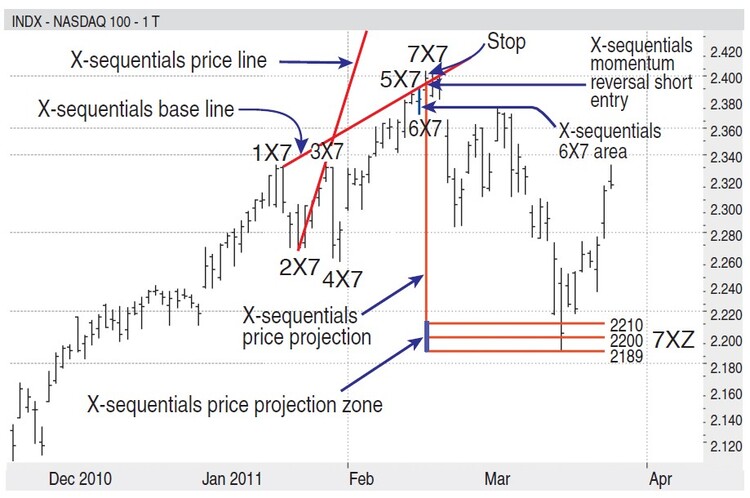
When you add the 6X7 area to the price projection, you get your price projection zone, 7XZ. The down move bottomed at 2188.92 on March 16, 2011, after which the NASDAQ 100 reversed upward. The same rules apply to bullish X-sequentials X7 patterns, which is what we’ll look at next.
Advanced Books and Courses on Technical Analysis


Bullish X-sequentials X7 momentum reversal
In Figure 8 we see the X-sequentials base line and how the market’s momentum drives prices downward. When the momentum reverses and drives prices above the base line, we have a momentum reversal.
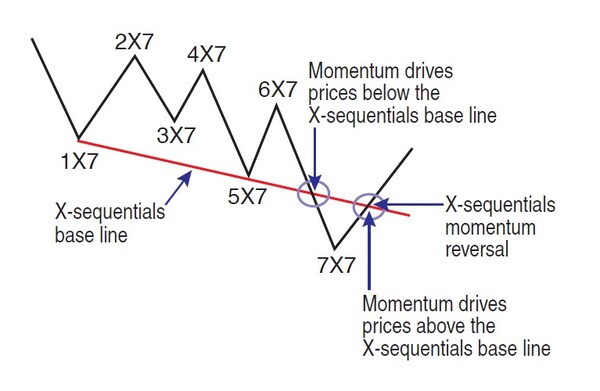
In Figure 9 we see a bullish X7 scenario. The base line can only be drawn when there are two lows, with a higher low in between. The first low is 1X7, the second low termed as 5X7, and the higher low in between is 3X7. Extend base line to the right side of the chart and wait for your long entry signal. This is the X-sequentials momentum reversal.
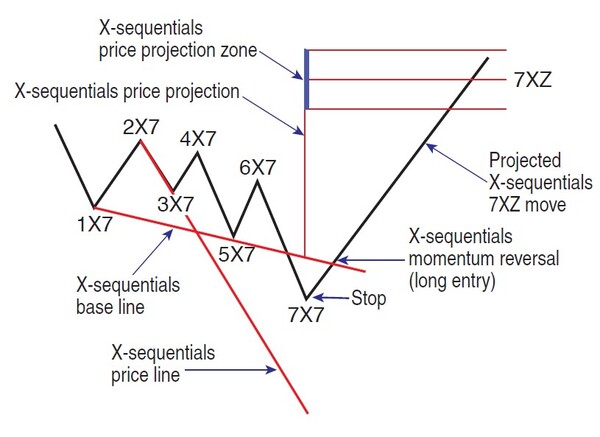
From the low of the down move segment 7X7, the momentum has reversed and broken the base line upward. Set your stop at the low of 7X7. Next, draw the X-sequentials price line by connecting the high of the up move 2X7 with the low of the down move 3X7. Then extend the price line relative to the low of 7X7.
By connecting the base line with the price line through the low of 7X7, you get the price projection line. By drawing a line that is symmetrical to the projection line from the base line, you get your X-sequentials price projection. Extend the price projection by the 6X7 area (distance from the high of 6X7 to the base line) to get your price projection zone, which is where you can expect price to hit. As mentioned before, in some cases the 6X7 area must be subtracted from the price projection. The projected up move is the X-sequentials move 7XZ.
MINI–CRUDE OIL
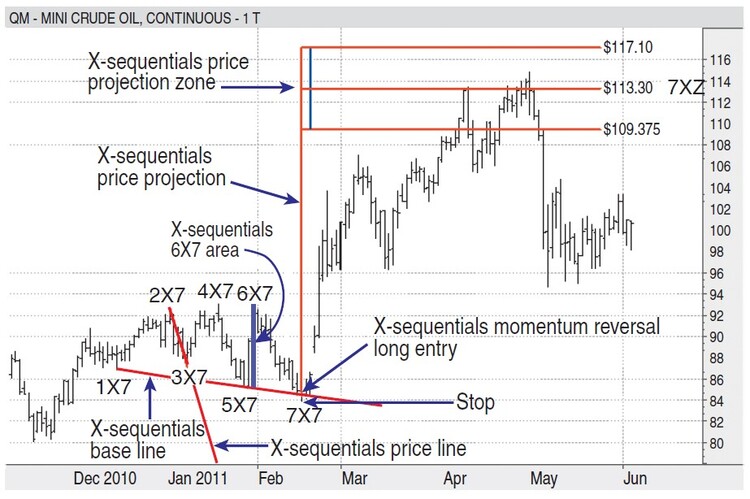
Let us apply this pattern to the chart of mini–crude oil (Figure 10). Mini–crude oil formed a bullish X-sequential X7 pattern from December 15, 2010, to February 15, 2011. We see that the low of 3X7 is higher than the low of 1X7 and the low of 5X7, which is a requirement. The X-sequentials momentum reversal indicated an up move with a price target from $109.375 to $117.10. This time, the 6X7 area had to be subtracted from the price projection. The up move 7XZ peaked at $114.825 on May 2, 2011, and crude oil reversed downward.
CONCLUSION
I have found the X-sequentials analysis works in every time frame and every market. It allows you to spot momentum reversals and derive price forecasts. It is likely that a reversal could take place, but prices keep oscillating around the X-sequentials base line. At such times, stops can be taken and you can reenter the market after the next break of the base line. There are several variations of the X-sequentials X7 pattern. Here are a few:
- Sometimes the X-sequentials 6X7 area must be subtracted from the price projection.
- Depending on the market’s current momentum, a half X-sequentials price projection may be applied (“7XZ ½”).
- When a projected swing goes beyond the X-sequentials price projection zone, a 1.5- to twofold price projection may be necessary.
It would be worth your while to do some research on historical charts to train your eye to apply these different variations. It will also give you an opportunity to see how well the X-sequentials X7 pattern could work for you.
- Devin Sage is the author of the book Besser Traden Mit X-Sequentials.