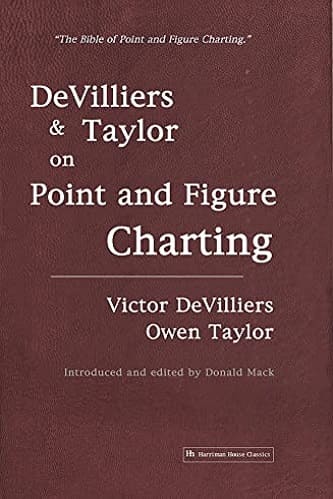
DeVilliers and Taylor on Point and Figure Charting
$34.66
Little is known about the personal lives of each of these authors, but in surveying their other books and writings, a more informed picture emerges of their capabilities in their chosen field, stock and futures market analysis. From the quality and clearness of the writings in this and other of his works, it soon becomes apparent that Victor DeVilliers was not only very knowledgeable on the markets but he had the uncommon talent to put it into written words. (Most market authors are generally better traders and investors than writers.) On the other hand Owen Taylor was certainly extremely capable, being more the expert on the technical aspects of market analysis, something easily ascertainable from the Technical Analysis subjects that he presented in his own books and booklets.
It is to the credit of both authors that they recognized just how valuable to investors and traders the Point and Figure method could be and that they saw fit to produce this fascinating work on a subject that in its essence is just putting small “Xs” on graph paper. But how to put them to graph paper and how to read their meanings is what can separate the trading and investing boys from the trading and investing men. Surveying all of the writings that have been published over the years, we find there have been and are a number of good, very good and excellent books on the Point and Figure methodology and its star attributes. However, every once in a while someone comes along and writes what is easily the seminal work, the finest on its particular subject. Some 65 years later we can attest to the fact that Victor DeVilliers and Owen Taylor rule the roost on their chosen subject with the two volumes republished here, which taken together, have to be considered the ultimate – “The Bible of Point and Figure Charting.”
Contents:
- THE PRINCIPLES OF THE POINT AND FIGURE METHOD
- THE WEIGHT OF AUTHORITY BEHIND THIS METHOD
- ADVANTAGES OF THIS METHOD OVER OTHERS
- THE VITAL POINTS
- APPROVED METHOD OF ASSEMBLING AND MAINTAINING PROPER DATA
- THE SCIENTIFIC FUNDAMENTALS
- THE PRINCIPLES OF CHARTING
- ANALYZING TECHNICAL POSITION
- ANTICIPATING THE ACTION OF U.S. STEEL
- ANALYZING A CAMPAIGN IN WESTERN UNION
- JUDGING THE MINOR SWINGS
- HALF POINT TECHNIQUE IN ATLAS TACK
- THE MAIN TREND AND MAJOR CYCLE CULMINATIONS
- TECHNICAL INDICATIONS AT A TURNING POINT
- PREREQUISITES TO SUCCESSFUL TRADING
- BASIC PRINCIPLES – THEIR APPLICATION
- CHART FORMATIONS INDICATED THE INCEPTION OF AMOVE
- RECURRING OPPORTUNITIES DURING THE MOVE
- THE ONE POINT CATAPULT AND SEMI-CATAPULT
- GAUGING THE VOLATILE ISSUES
- HOW TO RECOGNIZE ADDITIONAL OPPORTUNITIES IN VOLATILE STOCKS
- CULMINATION, LIQUIDATION, PROFIT TAKING, AND THE SHORT SIDE
- THE THREE POINT CHART
- COORDINATING THE ONE POINT WITH THE THREE POINT CHARTS
- THE COUNT – GAUGING THE EXTENT OF FUTURE MOVES
DeVilliers and Taylor on Point and Figure Charting By Victor De Villiers and Owen Taylor pdf
| Author(s) | |
|---|---|
| Format | |
| Pages | 305 |
| Publication Year | 2007 |
2 reviews for DeVilliers and Taylor on Point and Figure Charting
Only logged in customers who have purchased this product may leave a review.


Jordan Spencer (verified owner) –
i like this book… it is one of the best i bought on points and figures…
but there are not enough good examples…
Alyssa Maxwell (verified owner) –
If you are going to be involved in markets, this is reading that will always open your understanding of whats going on….may not be your main thing but it will always be with you