
Market Profile Liquidity Data Bank: Volume, Trader Types, and Reversal Signals
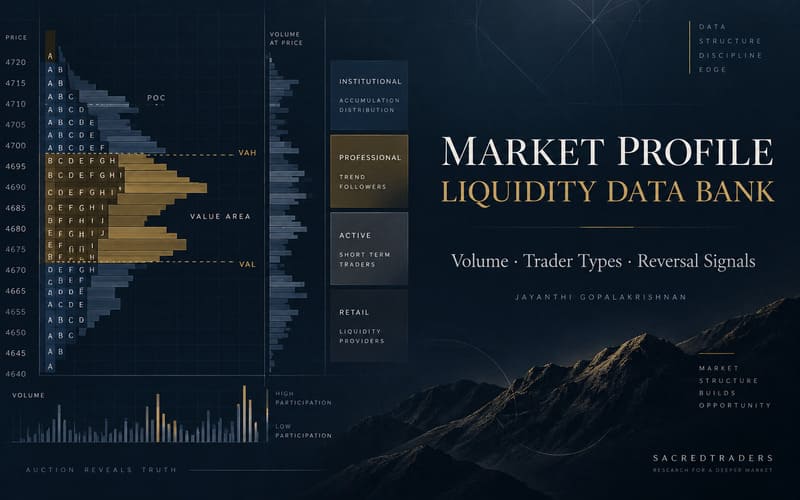
In this followup to last article on Market Profile, we go beyond Market Profile to determine price movements. Here’s a look at the Liquidity Data Bank, which helps traders detect price movements early. When prices move in one direction, it means that prices are being met with acceptance. It is important to realize that trends do not continue indefinitely and there will be points where price levels will be met with opposition, which will indicate either the start of a trend reversal or that the market is likely to go through a trading range. Reversals, whether they are of a major trend or between support and resistance levels, are key signals for making buy/sell or short/cover decisions.
The key to detecting the reversal points is through analyzing the volume traded. Apart from providing the Market Profile, the Chicago Board of Trade (CBOT) also provides the Liquidity Data Bank (LDB), which indicates the volume traded at each price level. Not only does it provide the total volume traded at each level, but also divides up the volume by types of traders.
TRADER TYPES
There are four different types of traders. They are indicated by the letters Cti, which stand for “Customer trade indicator.” The types (Figure1) are:
- Cti1 Floor traders
- Cti2 Commercial clearing members
- Cti3 Members filling orders for other members and nonclearing commercial traders
- Cti4 Members filling orders for the public or any other type of customer.

These four types of traders have different objectives and different trading styles. Floor traders, Cti1, make up the largest percentage of volume traded. Their interest is to trade a few ticks on large volume, and they are the ones who provide liquidity to the markets and form the essence of the futures market.
The commercial traders, Cti2, represent firms such as grain merchants, livestock producers, and savings and loan institutions. These traders buy and sell contracts for their inventory. Further, they receive market-related information prior to any other type of trader, and monitoring their activity can provide clues for your own trading. Later, I will discuss the trading style of the commercial trader and how it can help you observe certain factors in market activity.
The traders represented by Cti3 and Cti4 are known as residual traders and represent about 25%to 35% of the day’s volume. They tend to react to trades in a similar manner and usually in a wider range than do floor traders and commercials. In Figure 2, you can see the breakdown of the volume among these four types of traders.

LIQUIDITY DATA BANK (LDB)
The contents of the LDB are self-explanatory. You can see the volume at different price levels divided by the different types of traders. Volume information is combined with Market Profile of the specific market. The different columns are labeled as follows:
- Price Lists the price for the trading day.
- Volume Lists volume that occurred at each price.
- % Volume Volume expressed as a percentage of the day’s volume.
- %Cti1 Percentage of volume traded by floor participants.
- %Cti2 Percentage of volume traded by commercial clearing members.
- %Cti3 Percentage of volume traded by members filling orders through other members.
- %Cti4 Percentage of volume traded by members filling orders for the public or other outside customer.
- Brackets The Market Profile graphic for the trading day.
- Volume Activity Total broken down and the percentage traded by the different participants (Cti1 to Cti4). You can compare data of a specific contract with details of other contracts in the market. Bear in mind that the arrangement of the information varies from vendor to vendor.
- 70% Volume Summary Provides information on the quantity traded within the volume value area.
- O/H/L/C Summary Isolates activity that took place at the open, high, low, and close.
USING THE LDB
If you read last month’s article, you should recognize the profile seen in Figure 2 as that of a normal day. Data vendors such as Cisco provide the percentage of the day’s volume that occurred at the open. In this example it is 1.6%, which is relatively low. This usually indicates that the market will probably trend. Volume for September 1999 soybean contracts shows the breakdown of the quantity traded by different types of traders. Here, the floor traders make up 48.5% of the volume, the commercials 1.0%, and the residuals 50.5%. Clearly, the residuals make up a substantial percentage of the volume, further confirming that the market is likely to trend. Usually, when the floor traders or the commercials dominate the market, it implies that the market is not trending. If the residuals dominate the market, it is likely the market will trend.
When you look at the commercial activity (%Cti2), you can see that they traded actively at $465.60, which is at the lower extreme of the value area. There was very little activity at the upper extreme, indicating that there was no appreciable interest in selling at the higher prices. Prices would have to go higher to attract commercial selling. Monitoring commercial activity is important and again will be discussed in detail later.
The 70% volume summary shows the price range where much of the trading took place. In this example, the range is between $464.40 and $470.00, which is relatively wide. This indicates that traders will respond quickly to price shifts, a condition indicating a volatile market.
TESTS
It is helpful to compare any given day’s profile to that of the previous day. This can give you an idea of which way the market is trying to move. Sometimes this will be crystal clear, but there will also be times when it will be difficult to determine which way the movement may take place. I will show you various tests you can perform to determine the general direction of the price move. Some results may give conflicting signals, but by tabulating these results, you can usually determine whether upward or downward price movement is dominant.
Figure 3 shows the data for September 1999 soybean contracts for three trading days. Starting with the trade facilitation test, you can see that the open on August 30, 1999 ($470.00), was higher than the close of August 27, 1999, indicating that the market is headed higher.

It is also helpful to analyze the total volume traded on these two days. On August 27, 1999, the total volume was 3080, whereas on August 30, 1999, it was 4078, significantly higher. This was an indication that the upward price movement would continue.
Volume activities at the extremes provide clues to anticipate market direction. I’ll use the data from both August 27, 1999, and August 30, 1999, to calculate this. Using four ticks, the percentage volume for the top four prices of the day’s range on August 27, 1999, was 16.8% (0.1 + 0.4 + 3.8 + 12.5) and 8.2%(0.1 + 0.1 + 7.7 + 0.3) for the bottom. For August 30, 1999, the results were 5.6% (1.6 + 0.0 + 4.0 + 0.0) for the top and 21.6%(2.7 + 8.4 + 0.5 + 10.0) for the bottom. The higher activity on the upper extreme on August 27, 1999, implied that the buying trend would continue. On the following day, the higher volume traded at the lower end, indicating that the upward trend would not continue, possibly indicating that a resistance level had been reached.
Another useful test is to compare the volume value area for the two days. The range for the volume value area on August 27, 1999, was 32 (4674-4642) and the range for August 30, 1999, was 56 (4700-4644). The higher range on August 30 implied that prices would continue to move higher.
Advanced Books and Courses on Market Profile, Volume & Order Flow




As indicated in last’s month article, the value area may be calculated in two ways: volume and time-price opportunity (TPO) count. The two methods may provide slightly different results. Comparing the volume value area and the TPO value area can reveal further clues to the market direction. If the volume value area is higher than the TPO value area, even slightly, it is an indication that prices will move higher. On both August 27 and August 30, 1999, this condition was evident. This was another indication that the market would continue to move up.
In order to test the trend of the market, an analysis known as the average high volume can be used. For this calculation, you have to identify the five highest percentage of total volume figures, add them together, and calculate the average. The larger the average volume figure, the lower the probability that a trend is continuing. In the example in Figure 3, we see that for August 27, 1999, the result was 10.74 ((13.1 + 12.5 + 11.3 + 8.6+ 8.2)/5). At this point, this value does not reveal anything significant because you do not know the value from the previous day. On August 30, 1999, the result was 9.06 ((10.1+ 10.0 + 9.2 + 8.4 + 7.6)/5), lower than that of the previous day, indicating that the possibility of a trend was higher.
Another commonly used method is the dispersion of volume, the calculation of which is explained in the “Dispersion of volume calculation.” I will use the value area determined by the TPO count as opposed to the one arrived at by volume. This narrows the range slightly but centers it. The dispersion of volume on August 30, 1999, resulted in 45.35% above the high of the volume price and 15.05% below; clearly, there is a strong imbalance between the two. This shows that traders are more inclined to sell and hold above $466.40 rather than buy and hold. However, the profile shows that the market is balanced, since it closed in the middle of the range, and hence, using this method, it is difficult to see where the market will open the next day.
A summary of these test results for August 30, 1999, is displayed in Figure 4. Most of the test results indicate that there was a high probability of prices continuing to move up. The data for August 31, 1999, shows what actually happened the following day. The September 1999 soybean contracts clearly showed evidence of prices continuing to move upward.

By now, you should have an idea of what to look for in the LDB to help you gain knowledge of the direction of price movement. It is best to keep a running record of all these tests and think about the implications; avoid just adding up the ups and downs and blindly making an analysis. Your objective is to get an intuitive feel for the market from the data available to you through the LDB. Having a running record should help you achieve this.
THE IMPORTANCE OF COMMERCIALS
The commercial is the type of trader whose activity provides clues to the movement of price. Monitoring their activity through LDB can help you detect shifts in price directions, triggering profitable trading signals. Since commercials have to conduct business frequently and they have access to relevant information before other traders, unexpected activity from them may provide clues to price movements (Figure 5). Although they can “hide” their operations —that is, not have their trades show up on the %Cti2 column— monitoring their activity can still provide significant information.

Usually, commercials trade actively at the extremes by entering responsively — selling when prices are above value and buying when they are below it. This type of action gives you an idea of where the support and resistance levels are. There will be occasions when the commercials may act differently, selling when prices are below value and buying when they are above; this indicates they are entering the market initiatively — that is, the commercials are taking the initiative in this activity. When this happens, you know that there has been a shift in the commercial trader’s perception of value. This change can provide momentum for the prices to move away from the value area. By detecting this situation in play, you can take advantage of some profitable trading opportunities.
LDB is updated on an hourly basis and includes volume information and Market Profile. This gives you the opportunity to track volume changes during the trading day. You can identify which type of trader is the more active, which prices are being accepted or rejected, and where the value area might be. Comparing trading activity among the different types of traders on an hourly basis can provide clues to changing conditions in the market.
INTERPRETING COMMERCIAL ACTIVITY
Since the commercials are the first to respond to price changes, an increase in their activity can indicate the start of an upward or downward price movement. Figure 6 shows a running profile of commercial activity for six days. The %Cti2 column reveals certain factors about price movement. Since the commercials move the prices, it is important for off-floor traders to monitor their activity. Determining the amount of commercial activity that took place within the volume value area and outside it can help you do this. (See “Calculation of value outside value area” for calculation.)
All traders like to take advantage of trend reversals by getting in early and riding profits. These reversal points are difficult to pinpoint; what may seem like one may end up being a short-term price movement. Tracking commercial activity will give you insight into determining whether a trend is likely to continue.

Prior to interpreting commercial activity, you should know the average percentage of volume generated by the commercials for a specific market. This can be determined by taking an average for the last 10 days. Starting with the first profile in Figure 6, commercial activity is 6.4%, with 6.0% taking place within the value area. The average commercial activity calculated from the last 10 days is approximately 6%, which means that trading from the commercials is about average. Average activity above and below the value area equal 2.15% and 7.71%, respectively.
Commercial activity below the value area is higher than within, which means that the commercials were trading responsively. This, together with the profile, indicates aggressive buying during the early part of the trading day with no inclination to sell when prices go higher. On the following day, August 25, 1999, prices showed upward movement. The commercial activity represents 5.5% of the volume within the value area, which is slightly less than that of the previous day. This does not give a positive signal for continuation of price movement. The %Cti2 above the value area is zero and 4.49% below it. These are not significant results because both are lower than the percentage of volume traded within the value area. When it is difficult to determine market direction through the two methods mentioned, compare commercial activity at the extremes. In the present example, the commercials were more active at the upper extreme, leading me to believe that they were selling toward the close.
You should also look at other factors that were mentioned previously, such as trade facilitation, volume, range of volume, value area and the relationship between volume value area, and TPO value area. These will help in getting additional confirmation signals when you are not sure what to expect for the following trading day. You can see the profile of a nontrend day on August 26, 1999. The value area range is less than that of the previous day, and commercials represent only 5.3% of the activity within the value area. Average commercial trading below the value area is 5.4%, which is higher than that within. All three of these tests indicate negative signals. The value area of August 27, 1999, was lower than that of August 26, 1999, and showed higher commercial activity, indicating selling activity from the commercials. This is an example of commercials entering the market initiatively.
A look at the profile shows that prices moved lower and closed at the lower extreme. Average commercial activity above the value area is 3.55% and 6.03% below. Both are below that within the value area, so this does not suggest anything significant. The lower value area with increased commercial activity together with a profile that shows increasing activity toward the close suggests that commercials were selling aggressively on August 27, 1999.
The fall of the value area on August 30, 1999, should be a strong indication that this market is headed lower. The percentage of commercial activity within the value area is much lower than that of the previous day. Further, the volume value area is at the upper extreme, indicating aggressive selling. Most of the commercials appear to have already sold off their positions, perhaps because their interest has been reduced. The profile shows a strong downtrend during the F period. The data from August 31, 1999, were added to show that prices did indeed head lower. Commercial activity reduced significantly, providing no indication of a reverse in price movement.
IN PERSPECTIVE
Activity among floor traders does not make a significant contribution to price movement. Trading activity of the residuals produces a much wider price range than any of the other traders. Focusing on the trading activity of the commercials and residuals will reveal clues that may help you get a headstart on your trading.
Figure 7 is a price graph of December 1999 Treasury bonds together with a chart showing net volume activity of the four different types of traders. In most cases, when the commercials are actively buying, the residuals are selling. Commercials are the first to enter the market. From late September 1999, T-bonds show a sharp decline in price. You can see from the volume activity chart that from September 28 to September 30, commercials were selling aggressively. However, the public started buying more during this period. On October 1, 1999, the public had reached their buying extreme, whereas the commercials were at their maximum selling point.

Bond prices continued their down-ward trend until October 25, 1999, at which time they appeared to hit a bottom and started rallying after that. Commercials did not show any buying enthusiasm; only the public increased their buying activity after October 28. The information appears to indicate that this rally is not the beginning of a trend reversal. Activity in the bond market shows a pause in this rally on the days following October 29, 1999.
CONCLUSION
Those who are interested in but have used neither the Market Profile nor Liquidity Data Bank should spend time studying them and understanding the development of the various patterns. As with most other concepts, experience is what makes for proficiency, and this is certainly true in the case of Market Profile and the use of the Liquidity Data Bank.
By analyzing the commercial traders’ actions, you will begin to notice that they will buy aggressively prior to an upside breakout or vice versa. You will also observe that they will start selling before the residuals. Monitoring such activity will help you get a better understanding of how the markets operate, and put you in a better position to enter and exit trades. Commercials recognize value and provide a buffer for the markets. If prices get too high, they sell, and if the prices are too low, they buy. Floor traders and residuals follow the commercials that are the first to enter and exit the markets. The public is the last. Where would you rather be?