Trading Articles
Anchoring Support And Resistance By L.A. Little
Here’s how you can use support/resistance lines, swing points, and volume to anchor support and resistance zones. What does a horizontal support or resistance line mean to you? What gives it significance? Traditionally, the thought is that the number of highs or lows that happen to reside on the line is what gives the line strength. Coupled with that is the length of the line, so the longer the better.
HOW STRONG ARE THE LINES?
Figure 1 is a chart of the Semiconductor HOLDRS Trust (SMH) for a one-year period. I’ve penciled in two lines, the higher of which is resistance. That line has six “touches,” but that depends on the thickness of your pencil lead. That is a lot of touches, and the length of the line is respectable, for it’s been in place for five months. But given these two measures, how can you assign a measure to the strength of the resistance line and have confidence in it? What if it were one year in length with double the touches? Does that make it twice as strong?
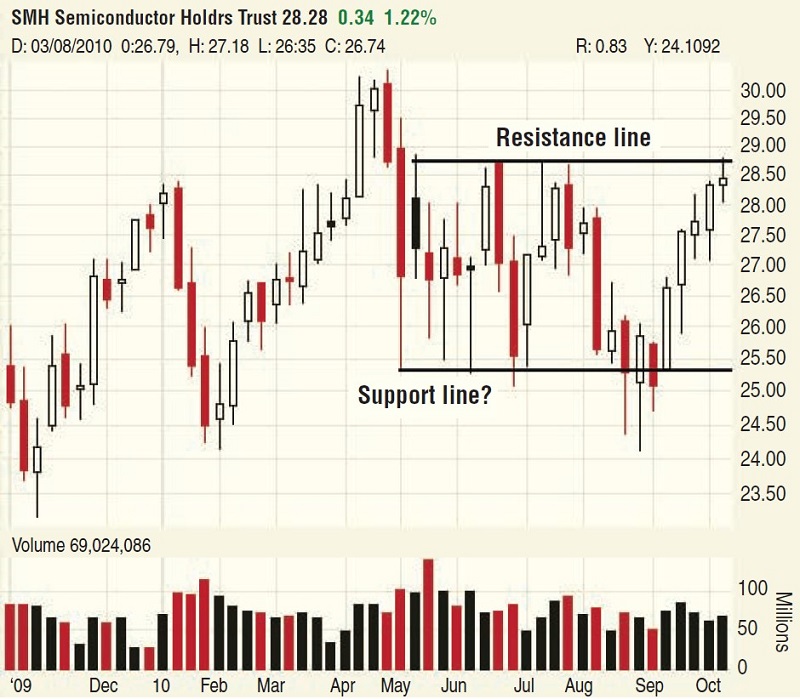
Unlike the resistance line, the value of the annotated support line is unclear. It looked like support for the first four months of its existence with four or five touches, but in late August, prices took a serious dip below the line, rendering it essentially useless. Using the same valuation measures, if you didn’t know that the line would be violated in late August, wouldn’t the support line have been almost as strong as the resistance line above? It existed for almost the same duration and contained almost as many touches.
What’s even worse is that the support line did turn out to be support in the end. Yes, prices dipped below the line, but they subsequently turned and traveled higher in a beeline fashion. There’s an adage that lines, like rules, were made to be broken, and that is the crux of the problem with support and resistance lines. Although trading strategies vary, the notion that the line should repel prices is at the center of each strategy. When that fails to occur, then existing positions are closed or new ones opened with the idea that the trend has changed.
ARE THE LINES CLEAN?
Unfortunately, using support and resistance lines has a number of issues. First and foremost is that the market is seldom so accommodating that it travels to a convenient line and immediately turns. Usually it is a lot sloppier than that. Remember, lines are made to be broken. The real issue is that there is nothing inherent in the process of connecting the tops and bottoms of bars that makes the line unassailable.
Given that trading strategies depend on knowing when a line has broken, another problem is how to tell when this has occurred. Since lines are so exact, the tendency is to view any small violation as a break. After a while, traders begin to see the line as fuzzy and thus give it a little room before deciding it has broken. But how much room is enough? No one knows.
Suggested Books and Courses About Chart Patterns


There is a simple way to avoid these problems. Just throw out the line and create a price zone — an area on the chart that denotes support or resistance but consists of a range of prices rather than an exact price. Further, anchor the zone to something of significance rather than arbitrarily picking tops and bottoms of bars and connecting the dots. How can this be done? Let me demonstrate.
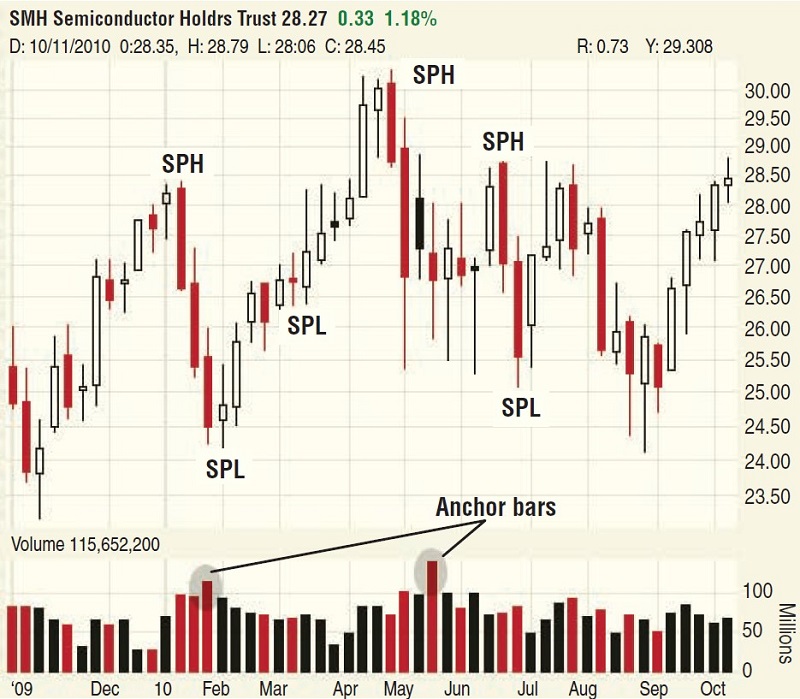
Figure 2 is a repeat of the SMH chart but is annotated to show two additional information points. The first addition is the swing points, which are essentially an algorithmic accounting of both high and low turning points in most cases. Because swing points typically define the tops and bottoms of a directional move, they are significant because they usually demarcate a turning point.
The other annotation highlights high-volume bars, which are referred to as anchor bars. A high-volume anchor bar is one where volume is significant compared to all other bars in this time frame. The idea is that if volume expands greatly, then that area of the chart has greater significance than the rest. In other words, some event(s) led a greater number of traders to either buy or sell their shares and do so with some disregard to price activity.
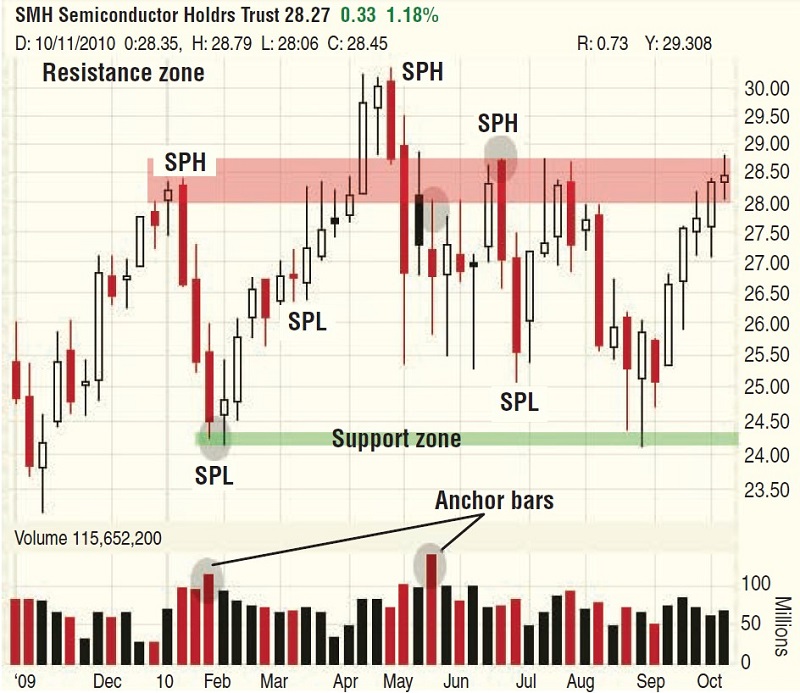
If we accept the assumption that anchor bars have greater significance, then it stands to reason that they can and should factor into the idea of support and resistance — and they do! In Figure 3, two zones are constructed utilizing swing point highs, lows, and anchor bars. The result is price support and reistance zones with greater significance than traditional support or resistance lines. The value of anchoring support becomes clear when you compare Figures 1 and 3; the support zone is anchored by a swing point low and a high-volume anchor bar.
THEY’RE SUBJECTIVE
Like drawing lines, support and resistance zones are somewhat subjective, although not overly so. The basic rule is to always use the highs or lows of the bar whether it is a swing point or an anchor bar. Sometimes the zones are thick and sometimes they are thin. The width of the zone is dependent on the data points exhibited on the chart. A zone that is too thick is less valuable from a trading perspective. In those situations, it is better to pass and examine other charts. Anchored support and resistance zones are always horizontal, as there is no way to anchor angled lines.
ANCHOR THEM
The value of any technical construct is dependent upon results. Trading results improve if a trader has a better understanding of where real support and resistance can be found on the chart. Combining anchor zones with swing point highs and lows provides a mechanism to do that. As a result, anchored support and resistance zones represent a marked improvement over lines.
L.A. Little is an author, professional trader, and money manager. His first book, Trade Like The Little Guy, shows small traders how they can consistently profit in the markets.