Trading Articles
Categorizing Stocks Using Price and Volume Action: A Framework by John Boik

By analyzing certain strengths and weaknesses, you can get a better handle on how stocks trade. Cause equals effect, therefore volume equals price. The concept seems simple enough in context. But trying to make headway of all the price movements of stocks can become a daunting task. One way to get a better grip on your watchlists and holdings is to categorize them based on simple price and volume action coupled with support and resistance areas. Stocks throughout market history have acted in similar ways due to the human element involved. Thus, a time-tested solution to get a better handle on how stocks trade is to analyze certain strength and weakness areas.
MOVING AVERAGES
Many traders and technical analysts use simple moving averages, which smooth out a stock’s price over a specified period of time. These act as either support (during rising prices) or resistance (during declining prices). Two of the most common are the 50-day and 200-day moving average (MA) lines. Other short-term lines that are often used are the 21-day and 10-day lines. Since the 50-day and 200-day lines are so frequently used, action around those areas can prompt some traders to decipher possible future price action (though, of course, nothing is certain in the markets).
During bullish or uptrending markets, the 50-day MA line has historically acted as a support area for the best price performers. The shorter-term 21-day line has been a support area for the real stock price performers, as they seem to use that time frame (a month of trading activity) as a floor while prices keep rising. Just the opposite tends to occur in downtrending markets. The 50-day line can turn into resistance as a stock’s price keeps falling.
The 200-day MA line also has history on its side as far as repetitive behavior is concerned. Many times, when a stock breaks below the 200-day line and/or the 50-day line crosses under the 200-day line (forming what is referred to as a “black cross”), prices generally continue to decline, especially if the overall trend of the market is down. In addition, many of the best price leaders throughout history have used the 200-day line as a bottom as they go on to build constructive basing patterns.
CATEGORIZING STOCKS
Now that we have history on our side and a few simple technical areas to focus on, we can begin to categorize stocks in certain groups based on their price and volume activity and their action around a few of these critical moving average areas.
I tend to categorize stocks into one of six different categories. In times of choppy market activity and basic nontrending environments, all categories will have some participants and will most likely be evenly grouped. In strong uptrending markets, only three categories usually carry names, and during strong downtrending markets, the other three categories usually hold the majority of names. The different price/volume and support/resistance action areas can be organized as follows:
- Base builders/pullbacks
- Recent breakouts/bounces off support
- Current leaders/monster stocks
- 50-day volume break/resistance
- 50-day/200-day trading range
- 200-day break/black cross
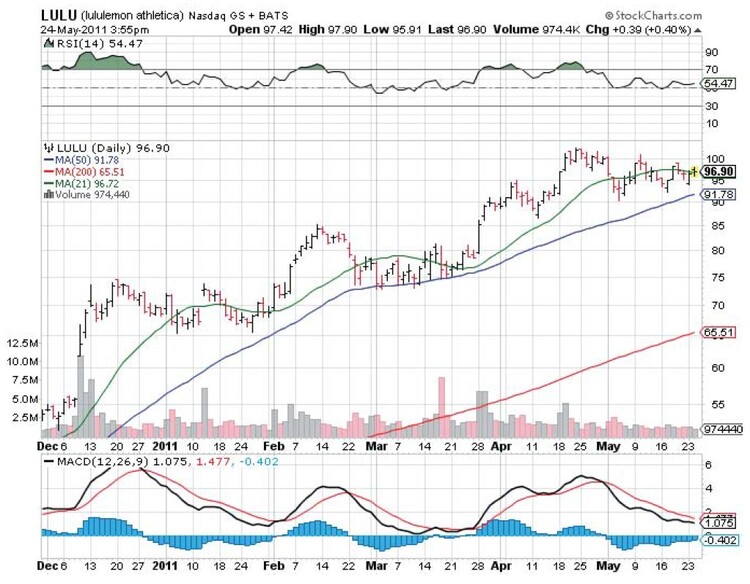
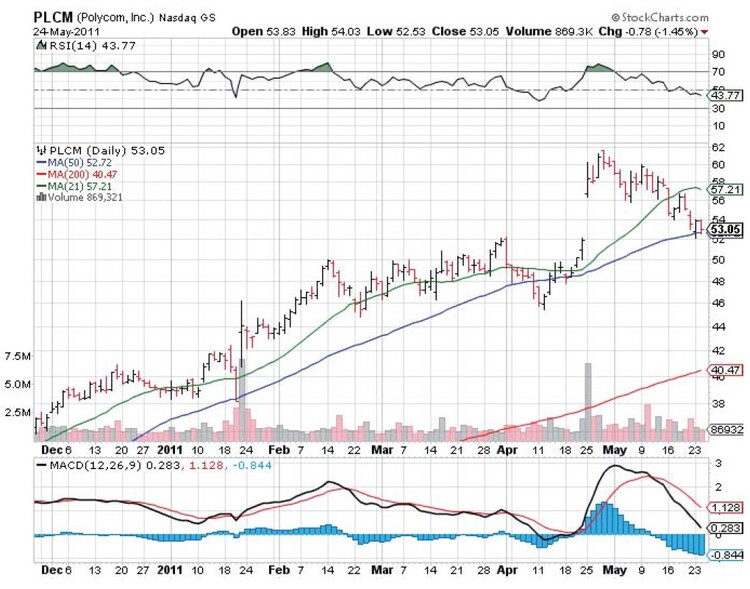
The first three categories apply best in uptrending markets and would have a decent quantity of stock names during a strong market run. The first category, base builders/pullbacks, should feature strong stock candidates that are building proper bases, such as the chart of LULU in Figure 1, and/or are prior leading stocks that pull back to either their 21-day or 50-day moving averages as they consolidate prior gains, as you can see in Figure 2. The key is to see if they find continued support there and are able to spring back up off that area. Those bounces off support can then be used as new buying opportunities. The other group would be classic breakouts that occur from proper base building formations.
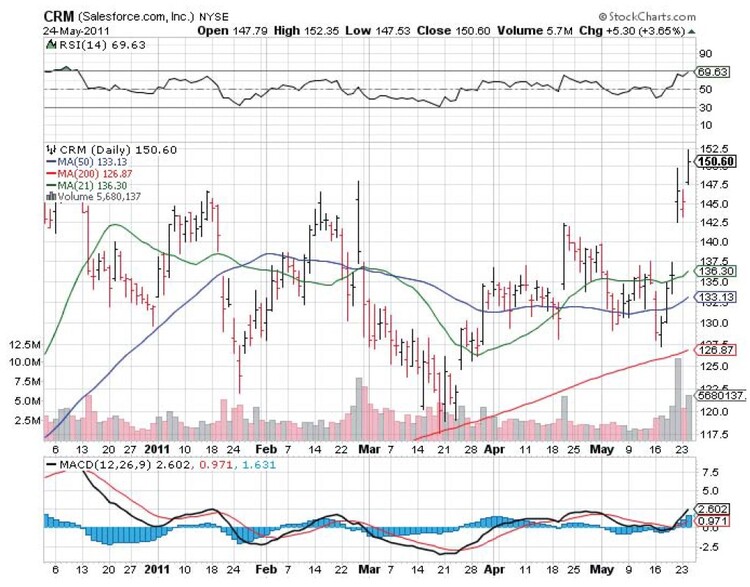
The next group, recent breakouts/bounces off support, has already been addressed in part. The bounce off support at either the 21-day and/or 50-day MA shows continued interest in the stock (Figure 3). Along with a volume signature, higher prices are more likely to continue. The recent breakouts would be volume-based breakouts from the prior category of base builders.
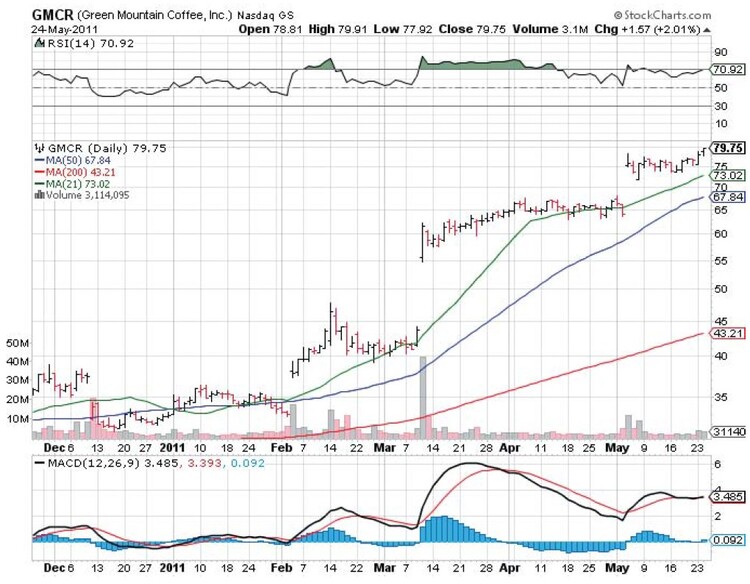
The third group would then chart the progress of the stocks that were in the previous two groups as successful breakouts or bounces off support areas that propel the stocks to continued new highs (Figure 4). This group would contain the real price leaders of any market environment. Of course, a strong uptrending market would be filled with a solid list of stock names, and a declining market may contain only a few or none at all.
As the market begins to consolidate, pull back, or decline in a more meaningful manner, the next three categories will increase with stock names (usually with failing leaders from the first three categories). These next three categories can be used for selecting viable shorting opportunities.
Advanced Books and Courses on Market Profile, Volume & Order Flow


The first one is the 50-day volume break/resistance category (Figure 5). As mentioned in the first two categories, if a visit back to the 50-day MA doesn’t hold or is breached with heavy volume, it becomes more and more probable that the upside move could be over and begin reverting to the downside. If a breach in heavy volume under the 50-day MA occurs and over the next several days to weeks the stock can’t get back over that key area, the upside move may be over. The 50-day MA could become a resistance area, as each time the stock approaches that region it gets slapped down. That in turn could become a nice shorting opportunity.
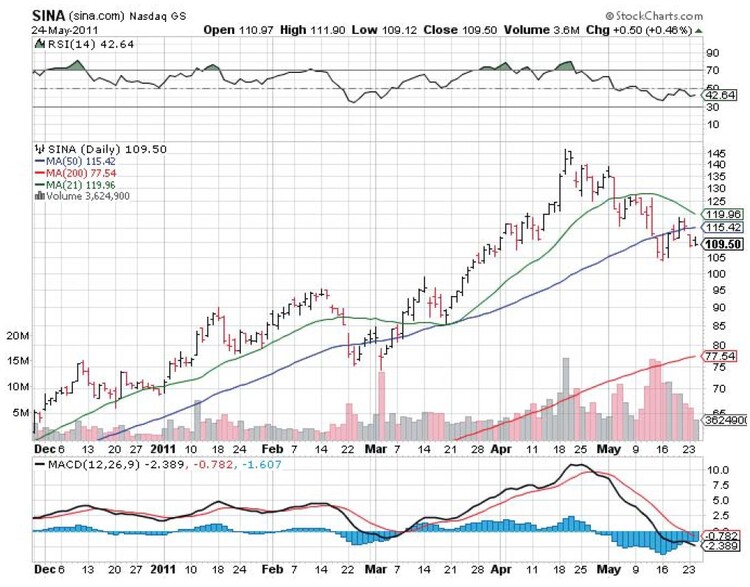
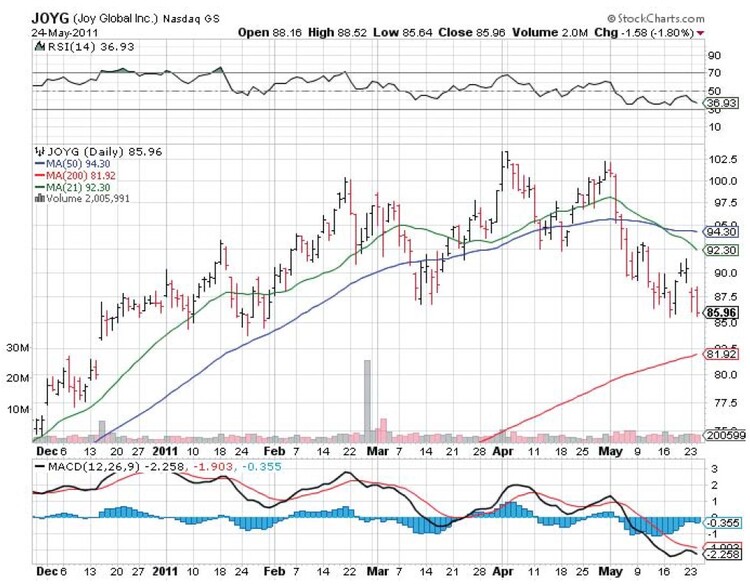
Once the category is confirmed, the stock will normally trade within a range between its 50-day MA and its 200-day MA (Figure 6). Continued resistance up to and at the 50-day MA will be fairly easy to see. As the 50-day MA continues to act as resistance, there will be trading opportunities between the 50-day MA and 200-day MA from both sides, depending on how quick you are.
Once a stock continues to trade between its 50-day and 200-day MA, it will be critical to observe the 200-day area. As mentioned earlier, most of the great stock price performers from the past built solid bases with support at the 200-day region. If the stock finds support at the 200-day MA and begins to ride back up in constructive fashion (meaning volume climbs with the rising price and volume declines when it pulls back in price), the next area to watch becomes that 50-day area again.
However, if a breach of the 200-day MA occurs (and usually with heavy volume), more weakness will likely prevail. The occurrence of a black cross is more than likely a sign of declining prices ahead. When that occurs and the stock cannot get back over its 200-day line, it would present another shorting opportunity. You can see examples of this in Figures 7 and 8.
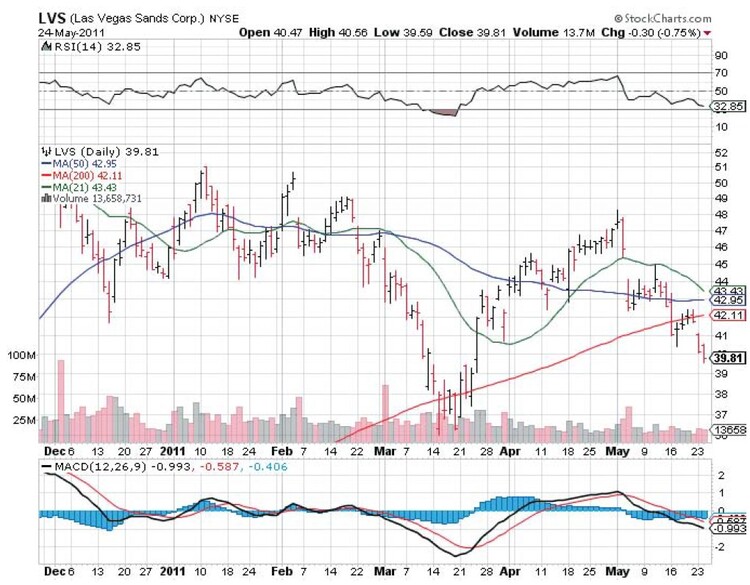
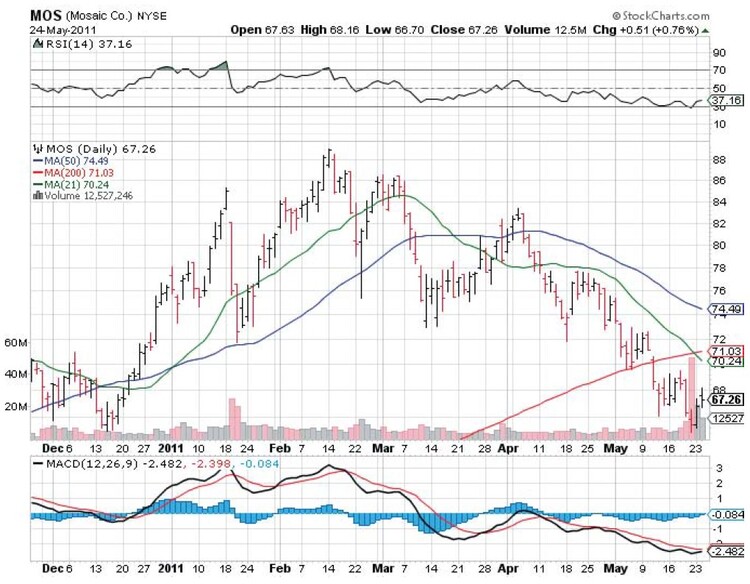
PROFITING FROM BOTH SIDES
As of late May 2011, the market is in a choppy to slightly downward trend. In such an environment, stocks can change categories quickly, and many categories will have several names listed. For purposes of the examples shown in Figures 1 to 8, I only chose liquid stocks that trade an average of more than a million shares per day.
By categorizing the movements of stocks on your watchlist and your current holdings, you can get a better understanding of where stocks are in certain trading ranges that can be classified by the key attributes of price, volume, support, resistance, and overall strength or weakness. Each category can give the nimble trader opportunities to profit from different sides of the market: long positions for the first three categories and short positions from the last three categories.
- John Boik is a financial controller and market researcher. He is the author of three books from McGraw-Hill: Lessons From The Greatest Stock Traders Of All Time; How Legendary Traders Made Millions; and Monster Stocks.