Trading Articles
Head And Shoulders Failure By Kenny Gilliland

How can you effectively trade one of the most recognizable chart patterns? Imagine this scenario: You are reviewing the charts of stocks that recently declined when a pattern jumps out at you from the screen — a head & shoulders formation. You place a stop market order to sell the stock short once the neckline is pierced. The order is ultimately filled and you wait for the stock to head south. At first, it declines slightly and then begins to move sideways for a week before heading up and back through the neckline. Luckily, you placed a stop order to cover your position a few percentage points above your initial entry. You vow never to trade that stock again.
A few months later, out of curiosity, you pull up the stock’s chart. You are shocked to see that it has lost over 40% of its value, the way you thought it would, since you placed your sell short order. You think to yourself, “What did I do wrong?” You can be right and still lose money, an old saying goes. Every indicator might be screaming that a stock is setting up for a terrible decline, but if you do not time the trade correctly, you can easily be whipsawed out, only to watch the stock continue to decline.
Timing is especially important when selling short. Equities seldom, if ever, decline in an orderly and uniform fashion. Price movements can be fierce, violent, and scary for traders. The head & shoulders pattern is one of the most recognized of all chart patterns. It does not take a seasoned trading eye to spot one forming on a chart. Moreover, trading books, publications, and websites routinely tout the reliability and ease of trading the head & shoulders pattern. Anyone who has sold short can tell you that picking a spot on the chart right below a pattern confirmation and filling an order does not guarantee a successful trade. While having the correct chart pattern is indeed significant, looking at other factors can assist you in whittling down your pool of short candidates to those with the highest likelihood of a significant decline.
A Refresher On The H&S
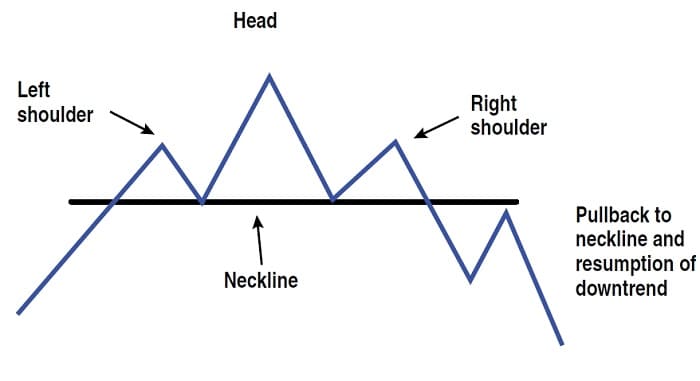
In case you are unfamiliar with the head & shoulders pattern, let me provide a brief introduction. Essentially, as a stock rises in value and hits new highs, the buyers are exhausted. This forms the top of the left shoulder (LS). A correction ensues whereby the stock declines to a support area and consolidates. Another push is made by the bulls. This time, the price moves above the previous high (the aforementioned LS). Again, there is less demand to buy at this point and the stock declines to approximately the area where the previous consolidation occurred after the decline from the top of the left shoulder. This forms the head (H).
Another consolidation occurs. The bulls push on. This time, however, the previous amount of enthusiasm is not present in the buying. Volume on this advance has diminished. The stock fails to break above the H and is approximately even with the LS, forming the top of the right shoulder (RS). Another decline begins.
The areas of consolidation that formed between the LS and H, and the H and RS form the neckline (NL). A trendline is drawn through the two areas. The trendline can be horizontal, slightly sloping down, or slightly moving up. A break below the trendline completes the head & shoulders pattern and results in a signal to sell short. Sometimes, a stock will pull back to the trendline. However, the NL acts as resistance and the stock continues its decline (Figure 1).
Eesier Said Than Done
Sounds easy, right? It’s not. A trader who simply looks at the pattern will likely lose money. Before selling short on any head & shoulders pattern that pops up on a screen, there are some things you can do to finetune your trade.
Look For A Large Price Runup
As William Peter Hamilton once said in reference to the market, “The tree does not grow to the sky.” The same holds true for individual equities. No matter the stock, no matter the business, a stock cannot rise in price forever. Today’s market high-flyers will be tomorrow’s dogs. Sooner or later, every big gainer will face a crippling decline. As a result, superstar stocks ultimately are the best shorts. To truly find the best candidates, the stocks should have at least doubled, or more, in price.
Suggested Books and Courses About Chart Patterns


After identifying a head & shoulders pattern, look at the stock advance. If it is/was a market outperformer, it likely shows a steady advance with few consolidation areas. Fewer consolidation areas equals a better short candidate. These consolidation areas can act as support and keep the stock from declining. At best, it may delay the fall; at worst, it may act as a support area that allows the stock to form a base and begin a consolidation that results in a major move higher.
Watch The VoLume
As the pattern progresses, volume should decrease on the advances. Therefore, volume on the upside of the LS should be higher than on the advance of the H. The advance on the RS should be less than on the H. Volume should also increase on the declines from the LS, H, and RS. A break of the neckline should also occur on heavy volume. The pullback to the neckline should occur on light volume.
Do Not Short Above The 200-Day Moving AverAge
It is enticing to see a short-selling stock at a new high plummeting at high speed. Just as with buying stocks, selling short also requires patience. When going long, you do not try to get in near the bottom, so why would you expect to sell short near the top? Thus, patience is required, even if you have a valid chart pattern forming. As a rule, a stock should not be bought unless the current price is above the 200-day moving average (200-day MA). The converse to this rule is that a stock should not be shorted unless its price is below the 200-day MA.
Why does something as arbitrary as the 200-day MA have any significance? Although it is a lagging indicator, the 200-day MA indicates the primary trend of the stock, be it upward, downward, or sideways. Although it is a lagging indicator, price trends are based on momentum. A price movement that begins to head in a given direction will likely continue on that path for some time. The importance of the 200-day MA is further reinforced in that institutional traders use this as the line to separate the healthy equities from the sick equities.
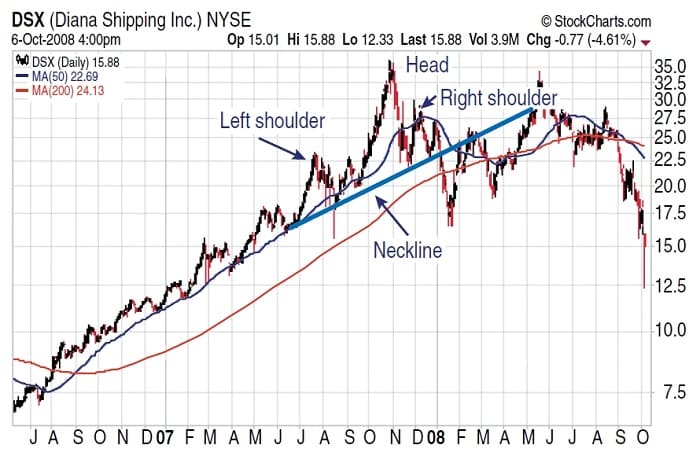
Therefore, when you locate a head & shoulders pattern forming, check both the 50- and 200-day MAs. The 50-day MA should have already been breached once or several times and beginning to head down. As for the 200-day MA, only where the neckline is pierced should be below the 200-day MA. Ideally, the 200-day MA should also be flat or beginning to turn downward, indicating that the trend has indeed changed. Figure 2 is an example of a poor shorting candidate. The neckline is above the 200-day MA, and the right and left shoulders are not symmetrical.
Look for Symmetry
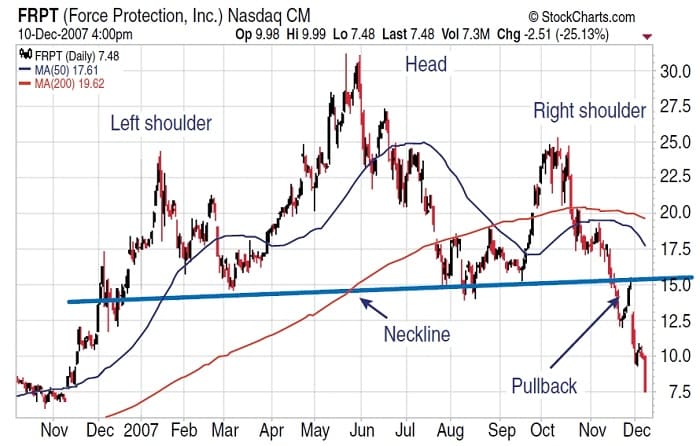
While the LS and RS do not have to be identical, they should be similar in size and duration. Occasionally, a head & shoulders pattern will have multiple heads and multiple shoulders. The only way to do this is to carefully scrutinize the pattern. While the stock may ultimately fall in price, if your trade is improperly timed, you will miss out. Figure 3 is a chart of a tradable head & shoulders topping pattern. You can see a clear neckline, well-defined left and right shoulders, a buy point below the 200-day MA, and a pullback prior to a continued decline.
Go With The Flow
While individual stocks do not move up and down in lockstep fashion, similar stocks do tend to follow a like trend. For example, if one oil refinery stock is moving up or down in price, it is likely that other oil refinery stocks are doing likewise. In most cases, not only will the trend be the same, but the chart patterns should be close in resemblance. This type of review helps confirm that the chart pattern you are seeing is a legitimate head & shoulders pattern forming. While stocks occasionally buck the trend and go in the opposite direction of those within their group, going with the flow provides extra confirmation that the stock is headed for a fall.
Respect The Market
Now that you have learned to finetune your short trades using the head & shoulders pattern, can I guarantee that you will profit every time? Absolutely not! Carefully analyzing what head & shoulders pattern you decide to trade will certainly cut back on losing trades, but it is no guarantee of success. On occasion, no matter how right you think you are about a stock’s price movement, the tape is the final arbiter of right and wrong in the stock market. Therefore, regardless of your opinions, respect the price movement and protect yourself by using a stop order to cover your position, especially when shorting stocks.
Kenny Gilliland is an attorney and long-time private trader.