Trading Articles
Jupiter Cycles and Financial Astrology in Stock Market Timing
I began studying technical analysis in the mid-1960’s, a time during which there was great excitement and interest in the stock market. In graduate school in the early 1970’s, I read all of the quantitative studies done on price movements. What caused stock prices to move? Was it news, was it fundamental developments in the economy, was it political developments? All of these studies came up with the same result. That is, there was no statistically significant correlation between market price movements and any of the previously-mentioned items. In fact, one of the stronger correlations, although it was not even statistically significant, was the relationship between inflation-adjusted earnings and the S&P500 (the highest correlation that was found was between stock averages and the Washington Senators baseball team batting average over three consecutive years, but we all know that this was simply a random occurrence).
During the soaring 1960’s, I was always amused by the fact that a highflying stock called STP was a big favorite with the investors. To this day, I can find no proof that STP oil treatment does anything beneficial for the engine of an automobile, yet everyone on Wall Street loved the stock. All of these experiences led me to one conclusion, that irrational, emotional waves rule what happens in our economy and our markets. Support for this view came from F.S..C. Northrup, one of Einstein’s contemporaries. He criticized conventional economics because he noted that movements in the marketplace were dependent upon people’s values. Because values are intangible and emotional, they constantly change, thus we need to know what people will value in the future in order to have a valid forecasting model.
The Doctor From India
After coming to my conclusion about a method that would measure these emotional waves, I began studying astrology s not until 1974 that I felt I was on the right path. An acquaintance at a conference informed me that a Dr. Rao from India told her that gold prices tended to peak when geocentric Jupiter was 90 degrees from Neptune. That aspect was approaching. In fact, it occurred at the time that Americans were finally allowed to own gold again after many years on prohibition. The popular belief was that the yellow metal would soar to unbelievable heights when America’s purchasing power entered the marketplace. Of course, the reverse happened; gold topped at approximately $190 an ounce and tumbled more than 50 percent in the ensuing correction. I was subsequently to discover that gold also reacted to other aspects of Jupiter and Neptune, such as the 22 1/2 degree, 45 degree and 135 degree aspects as well as the 90. This was an exciting development, but as some wise man said, “Invention is five percent inspiration and 95 percent perspiration.” Anyone who has attempted this type of study knows how much number-crunching is involved. The early pioneers, such as James Mars Langham, Lt. Cmdr. David Williams and L. Edward Johndro, could only explore limited areas due to the amount of work involved.
Development of the Astro Analyst
In 1976 I visualized a computer program which would do most of this work for us. I asked well-known astrologer Robert Hand, the president of Astrolabe Software in Orleans, MA to work on the program. We finally began to develop it in 1987. Graph 1 is a product of this work. Reading the graph requires a little explanation. The horizontal axis represents any cycle that the user chooses. In this case you are looking at heliocentric Jupiter’s passage through the zodiac. At the very bottom of the graph are numbers in increments of 10 indicating the percentage of the particular cycle that has transpired. In this case the cycle is 11.84 years long, so at the 50 mark, the planet is halfway through its 11.84 year cycle. Just above that, I have added in for those who are more comfortable with this symbolism. The vertical axis represents percentage change in the Dow Jones Industrial Average corresponding with Jupiter’s movement through its 360 degree orbit around the sun.
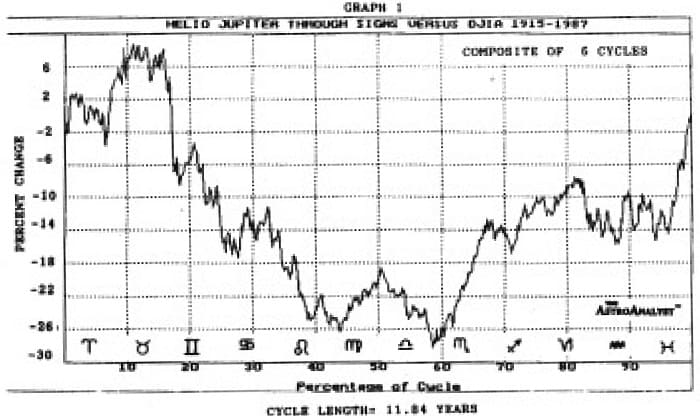
The graph represents the average of six cycles beginning in 1915 and ending in 1987. Examination of the graph reveals that the market rises approximately seven percent from its entrance into Aries to its high point in Taurus. It then declines sharply until it reaches the sign Virgo, rallying only to decline again into late Libra. It then makes a sustained rally through Scorpio and chops sideways until it gets to mid-Pices, at which point it rallies up into the sign Aries again. Remember that the graph you’re looking at is an average, and indicates tendency of market behavior during the Jupiter transit.
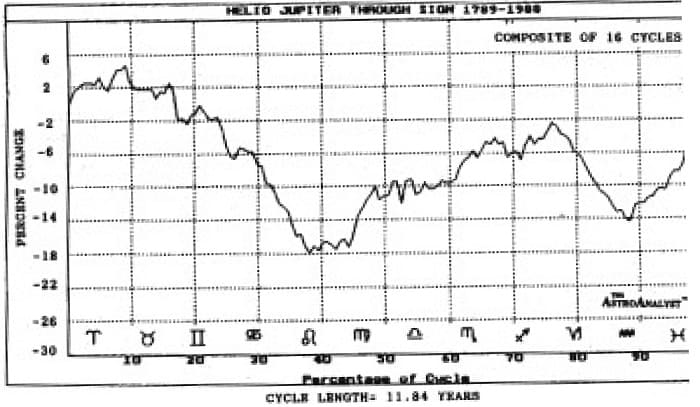
The next question to be answered is how consistent is this cycle? Graph 2 is constructed in the same way, except that it shows Jupiter’s passage around the sun from 1789 to 1988. It is a composite of sixteen cycles, using monthly stock averages from the Foundation for the Study of Cycles. Note that the graph tends to hold its shape, still topping in Taurus and declining afterward. There is some change in the Libra area, but other than that, the two graphs are approximately consistent. This was an exciting discovery. Robert Hand and I were pleased to learn that many of the astrological market indicators that had been developed were consistent, whether they had been looked at over 50 years, 100 years or 200 years. In addition, we have found that there is little difference between the effect of heliocentric and geocentric sign changes on the DJIA when analyzing outer planets.
How valuable would these Jupiter cycles have been to the investor? Seen geocentrically, Jupiter transited into Taurus in September 1928 with the Dow at 220 and left the sign for Gemini in August of 1929 with the Dow at 345, thus giving the investor a 57 percent gain. Most of these profits were erased as Jupiter entered Gemini and the market tumbled. In similar fashion, the investor who sold stocks in January 1977 when the Dow was over 1000 and Jupiter entered Gemini, would have moved to 825 in the next year. I also note that helio Jupiter entered Gemini in November 1988, contributing to the market’s tumble during that month.
Advanced Books and Courses on Astro Trading & Esoteric Methods


Zeroing in on the Jupiter Effect
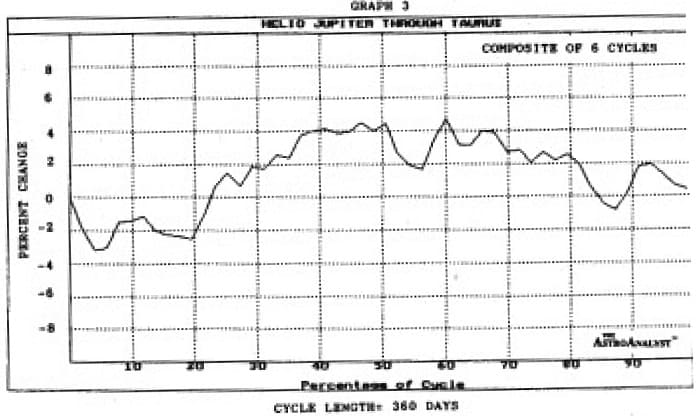
Let’s utilize another one of the Astro Analyst’s capabilities, and take a microscopic view of the Jupiter cycle. Graph 3 represents heliocentric Jupiter’s passage through the sign Taurus only. In other words, the horizontal axis represents only the 30 degrees of space known as the sign Taurus. This passage takes 360 days, therefore the 50 mark on the horizontal axis represents half on this 360 day cycle. The market tends to rise until approximately 19 Taurus, and then decline.
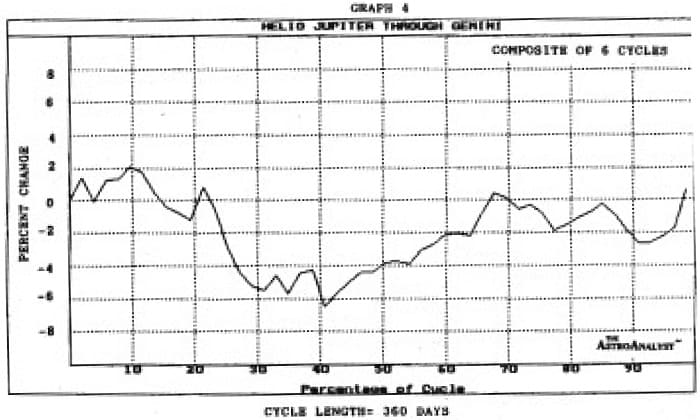
Graph 4 represents heliocentric Jupiter’s passage through the sign Gemini only. Note that the market tends to drop on average about six percent until Jupiter reaches approximately 13 Gemini.
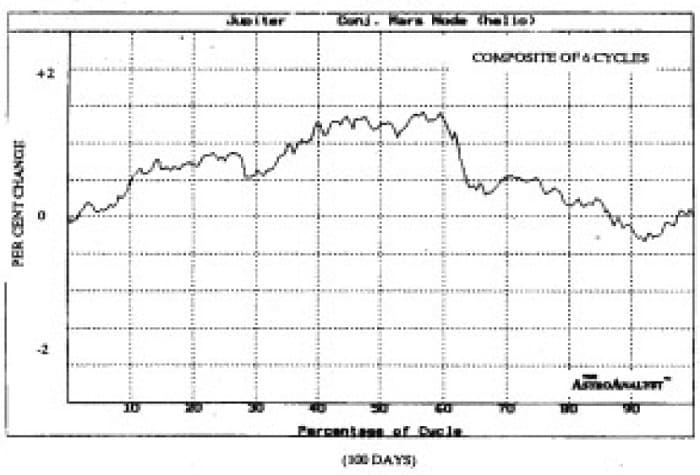
There is nothing special about these two particular degrees of the zodiac, however, from experience I realized that important planetary nodes lie at these degrees. Just as the moon has nodes, a well known concept in astrology, the planets have nodes as well. These points are created by the intersection of the planet’s orbit with the orbit of the Earth. The north node of Mars lies at 19 Taurus. Thus, the passage of Jupiter over this node tends to create a high. The halt of the market’s decline at 13 Gemini is no accident either. This degree contains the north node of Uranus. Graph 5 utilizes the Astro Analyst in a new way. The vertical axis has- the same meaning, however the horizontal axis represents 100 days. The 50 mark on the horizontal axis represents Jupiter’s transit over the node of Mars. In other words, the graph shows the average change in the market, the 50 days leading up to, and away from, the conjunction of Jupiter to the node of Mars. The user can analyze many planetary phenomena in the same way.
The Mars-Jupiter Cycle
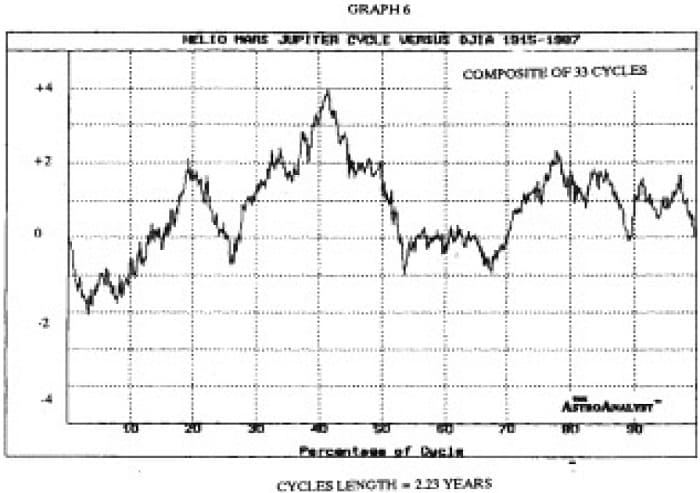
Graph 6 demonstrates the average percentage change in the market as Mars and Jupiter move through 360 degrees of their 816-day synodic cycle. At zero on junct, or zero degrees apart. At 50 on the horizontal axis, half of the 816-day cycle has expired and the planets are 180 degrees apart, or opposite, and so on. Note the tendency of the DJIA to decline prior to the conjunction (zero) and at the opposition (50).
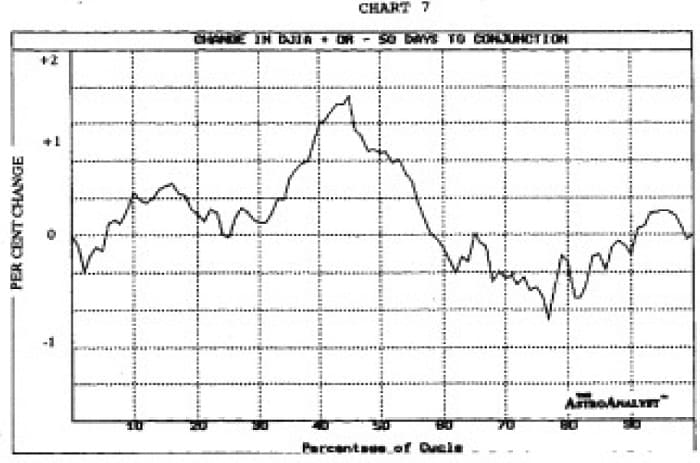
In graph 7, we see the DJIA change 50 days prior to and after the Mars-Jupiter conjunction. Equipped with this knowledge, the trader could anticipate a short-term decline if technical oscillators are overbought. Of course, this one cycle is not the only one. The Astro Analyst enables the user to ferret out all these relationships. ‘Thus we have gone from looking at a long-range cycle that would be of interest ot the long-term investor down to a closer view that would be of greater interest to the trader.