Trading Articles
The Eight Best Performing Candlestick Patterns By Thomas N. Bulkowski
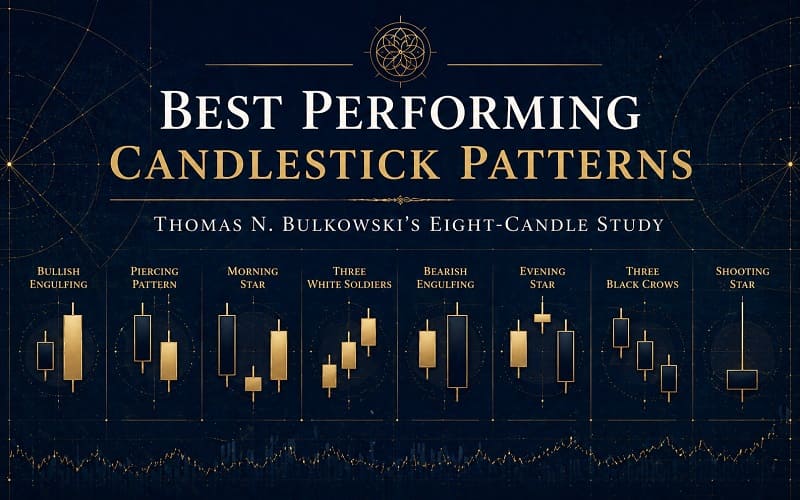
After removing rare candlesticks and combining reversal or continuation rates with performance after 10 days, surprising winners emerge. Those of you well versed in candlesticks will find this article surprising. It describes how single-line candles can lead to the best performance. In an earlier article, I discussed investment-grade candles, those that performed best as reversal or continuation patterns. In another article, I discussed candles that led to strong moves 10 days later. This article combines those two qualities and adds a third filter that removes rare candles to uncover the eight best-performing candles overall.
DEFINITIONS AND METHODOLOGY
Describing my testing methodology is necessary so everyone understands my measurement technique. I looked at more than 4.7 million price bars (candle lines) to identify and track 103 candle patterns. A close above the top of a candle represents an upward breakout. Similarly, a close below the bottom of the candle pattern is a downward breakout. That’s true of most candle patterns except for unusually tall ones, such as eight or 13 new price lines, where I used the last price bar upon which to conduct the up or down breakout test.
If price entered the candlestick from the bottom but exited out the top, it acted as a continuation. Similarly, if it exited in the same direction that it entered (entering from above and exiting upward, for example), the candle acted as a reversal. To exclude rare candles, I ranked the frequency of each candle found in the same database (500 stocks of 10 years’ duration). I split the frequency rank in half and threw out the rare ones (the rare half).
To find which candles had the best overall performance, I started with the plentiful candles, measured and ranked the reversal or continuation rates, added a rank for the price move after 10 days, and ranked the result. The idea was to find candles that performed best as reversal or continuation patterns, trended far enough in the breakout direction to make money, and appeared often enough to be identified. Here, I describe the top two candles in each category.
BULLISH REVERSALS
Figure 1 shows the top two candlesticks acting as bullish reversals of the downward price trend. To reverse that downtrend, price must close above the top of the candle pattern. “Above the stomach” is a two-line candle that begins with a black candle as the first day. It need not be a tall candle. The second day is a white candle that opens and closes at or above the midpoint of the black candle’s body. It can also be any size. The candle pattern acts as a bullish reversal 66% of the time and price climbs an average of 2.74% after 10 days. That combination wins it first place.
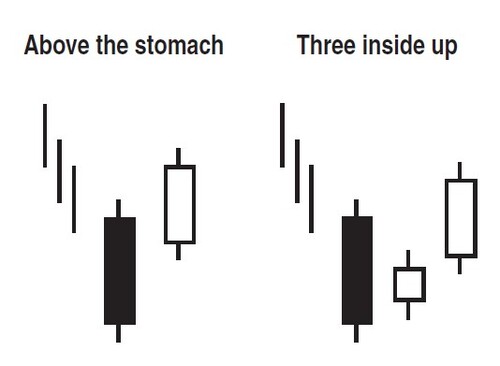
Ranking second for performance is the “three inside up” candlestick. The first stick is a tall black candle followed by a small-bodied white candle. The white body must reside within the black candle’s body. Either the tops or the bottoms of the bodies can be the same price, but not both. The last day of the three-day candlestick is a white candle that closes above the prior day’s close. The three inside up acts as a bullish reversal 65% of the time and price climbs 2.61% in 10 days, on average.
BEARISH REVERSALS
Figure 2 shows the next set of candlestick patterns. They perform best as bearish reversals. That means a rising inbound trend meets a downward breakout. Look for the bearish engulfing candle in a rising price trend and find a white candle. The last candle in the two-line pattern is a black candle that overlaps (“engulfs”) the white candle’s body. If the breakout from this bullish trend is downward, then it acts as a reversal. That occurs 79% of the time, and 10 days after the black candle, price has dropped an average of 3.56% in a bull market. In a bear market, the drop averages a more spectacular 5.92%!
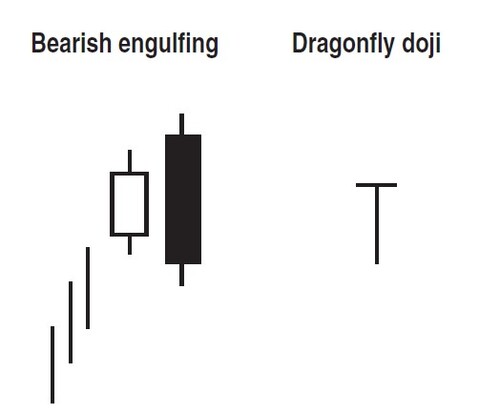
Placing second for overall performance is the dragonfly doji, and this is the first surprise. In this candlestick, price opens and closes at or near the high for the day while having a long lower shadow. The reversal rate is midrange (ranking 55 out of 103 candles), but the move 10 days later averages 3.89% and helps power this flyer. After an upward price trend, the stock must break out downward from this doji (qualifying it as a reversal), so look for a close below the bottom of the pattern.
Advanced Books and Courses on Candlestick Patterns

BULLISH CONTINUATIONS
Figure 3 shows the next two surprises for candles that act as continuations of the bullish price trend. For such a simple-looking candle, the long black day is a complicated line. Look for a body that is at least three times the average body height of recent candles but has shadows shorter than the body. Since the best performance comes after an upward breakout, look for the candle in a rising price trend (a continuation). As a continuation, its performance is mediocre, occurring just 53% of the time, but the 10-day performance averages 5.11% in a bull market.
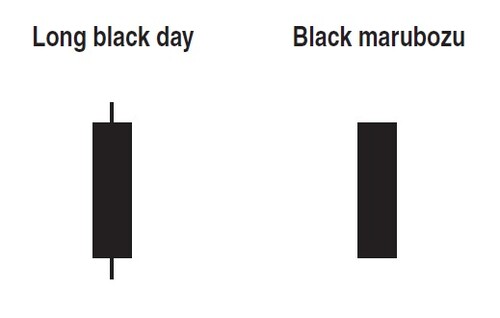
The closing price is near the bottom of this unusually tall candle, and with an upward breakout, the candle acts as its own reversal. Perhaps that springboard-type effect has some bearing on why price trends after the pattern appears. You can think of this mechanism as bullish traders buying the stock and powering it upward each day. Then sentiment changes and selling pressure overwhelms buying demand in a surprise blitz that sends bulls exiting their long positions. That selling along with new short sales leaves a long black day to print on the chart. In the coming days, the bulls emerge from hiding and attack the bears, resuming the uptrend.
The black marubozu is a simpler candle than the long black day. Although I show them with bodies of the same size, the marubozu is just a tall black candle with no shadows (it does not need to be three times the average height). It acts as a continuation 53% of the time, but price rises an average of 4.39% at the end of 10 days. That performance places it second in this category.
BEARISH CONTINUATIONS
Figure 4 shows our final pairing. They outperform all others when they act as bearish continuations in a bull market. These two candles are the opposite of the ones shown in Figure 3. The long white day has a body that is at least three times the height of the average candle over the prior few weeks. Shadows must be shorter than the body.
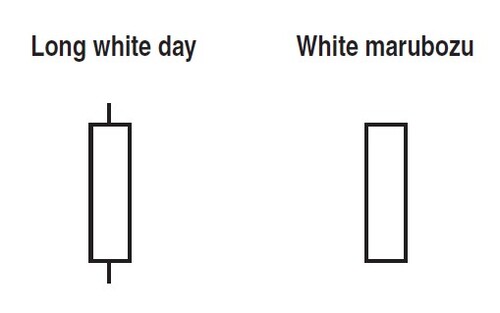
Since we are dealing with bearish continuations, price must be trending lower going into the candle with a downward breakout. The bearish continuation pattern occurs 58% of the time in this candle and price drops 3.91% at the end of 10 days. It’s the best performer in this category. In second place is the white marubozu. Look for a tall white candle without shadows. It acts as a continuation pattern 56% of the time and price drops 3.55% after 10 days. Since we are talking about the trend continuing, look for a downward inbound trend and a close below the bottom of the candle.
Again, these minireversals, where price closes higher during the day, confound the majority trying to push it lower in the downtrend leading to the candle. Traders may think that the down move is over so they buy, but when the bears return, their selling pressure makes price drop.
CLOSING POSITION
I have always avoided single-line candles because they tend to act randomly. However, under the right conditions, there is a place for them. When combined with price either trending higher or lower leading to the candle and after price takes a surprising breakout direction, the move 10 days later tends to be a good one. That’s what five of the eight best-performing candles seem to share.
- Thomas Bulkowski is a private investor with 30 years of experience and is considered to be a leading expert on chart patterns. He is the author of several books, the most recent of which is Encyclopedia Of Candlestick Charts.