Trading Articles
Gann, Astro-Dow Cycles, and Market Turning Point Validation
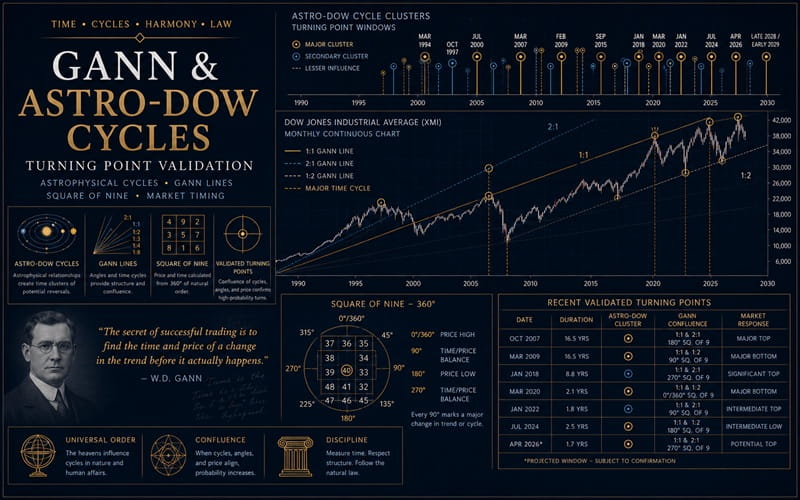
Market Astrophysics is an analysis approach that I have developed over the last decade which produces a set of turning point dates based on a computer model of the physical universe. It is the purpose of this article to explain how I use Gann techniques to help validate these turning the S&P or the XMI. I call these Astro-Dow two, three, and four points, which have turning points about once a week, once a month, and once a quarter respectively. Clusters of these points together are, like any cluster of cycle points, very good trading opportunities.
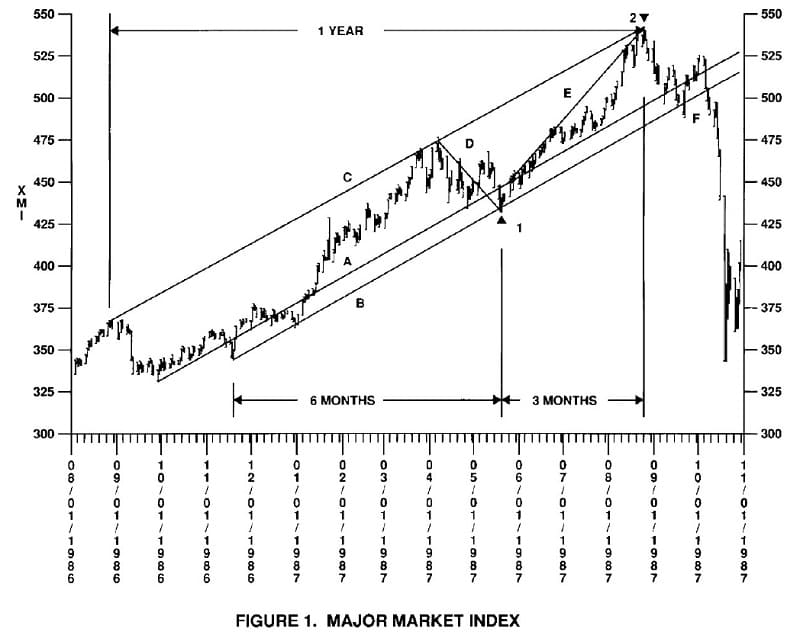
Like most such turning points, the Astro-Dow points are average points and may be off by a few days. For the best trades, additional information is useful to refine the timing and verify the point as a high or a low. Figure 1 is a daily chart (15 months shown) of the XMI points, thereby increasing significantly the odds of a correct trade. While applied here to the turning points I derive, this same validating approach can and should be used with any turning point system.
Turning point systems produce dates likely to be points of trend change, without necessarily calling for a high or a low. In my case, I have dates representing three cycles contained in the Dow or similar market averages, such as a losing trade. Further, if the market behaved normally, it could be expected to return to line C before a top was in place. I began looking for such a top as the summer progressed, and had noted the resistance offered by 1:1 line F. As August approached, I had an Astro-Dow cluster of an AD2 on 8/24 and an AD3 on 8/27. The latter was exactly one year from the 8/27/86 high from which line C originated. As the price action formed, it exactly touched line C on 8/13 and 8/25, the latter being within the Astro-Dow turning point cluster. Further analysis showed that this point was three months and a few days from 5/20, as well as at 541, exactly on the 180 degree angle on the Square of Nine. Going short for a return to at least line A was a high probability trade, with a stop at 543.
Advanced Books and Courses on Astro Trading & Esoteric Methods


In both of these cases, I had used Astro-Dow turning point clusters to come up with a hypothetical change in trend date. Then I used basic Gann lines, time cycles, and the Square of Nine to confirm the hypothesis. This systematic application of Gann’s work to support my own work allowed me to trade both of these points correctly and profitably. I also recognized the coming crash when line B was broken, but that’s another story for another time. Meanwhile, if you trade any sort of turning point system, try supporting it with this trio of Gann techniques.
In mid May, 1987, as the market was declining, I was awaiting a major turn, based on having a triple cluster of Astro-Dow points. I had an AD2 point 5/25, an AD3 on 5/26, and AD4 on 5/24. All of these points were expected to be lows, because the prior point in each cycle was a high. By that time I also had a pretty solid up channel formed by lines A and C, with secondary channel bottom formed by line B. All of these are standard Gann 2:1 lines which rise 1/2 point per-day. From the top on 4/7, I also had drawn the down sloping 1:1 line D. Where this line intersected line B on 5/20 could be a support area. Further checking of possible cycles (see [4]) reminded me that we were six months from the sharp Boesky low of 11/19/1986. So there I was, with everything saying a major bottom was about to happen, and possibly a few days earlier than the Astro-Dow cluster.
When the market made a low on 5/20, then closed higher 5/21, I knew that the probabilities that the major bottom was in place were very high, about as close to certainty as one can be in the market. Further, the XMI index, which follows the Gann Square of Nine nicely, bottomed at 432, just one square off the 270 degree axis. It was possible to buy here with a very close stop, with little fear of a losing trade. Further, if the market behaved normally, it could be expected to return to line C before a top was in place. I began looking for such a top as the summer progressed, and had noted the resistance offered by 1:1 line F. As cluster of an AD2 on 8/24 and an AD3 on 8/27. The latter was exactly one year from the 8/27/86 high from which line C originated. As the price action formed, it exactly touched line C on 8/13 and 8/25, the latter being within the Astro-Dow turning point cluster. Further analysis showed that this point was three months and a few days from 5/20, as well as at 541, exactly on the 180 degree angle on the Square of Nine. Going short for a return to at least line A was a high probability trade, with a stop at 543.
In both of these cases, I had used Astro-Dow turning point clusters to come up with a hypothetical change in trend date. Then I used basic Gann lines, time cycles, and the Square of Nine to confirm the hypothesis. This systematic application of Gann’s work to support my own work allowed me to trade both of these points correctly and profitably. I also recognized the coming crash when line B was broken, but that’s another story for another time. Meanwhile, if you trade any sort of turning point system, try supporting it with this trio of Gann techniques. You will like the results. Happy Trading.