Trading Articles
Hurst Cyclic Theory: Phasing Analysis and Market Cycles
This crash course on an almost-forgotten theory could shed some light on how you can trade consistently and profitably. In the 1970s, an American engineer named J.M. Hurst published a thesis about why financial markets move the way they do. His expounded theory was the result of many years of research, and it became known as Hurst’s cyclic theory. Hurst claimed a 90% success rate trading on the basis of his theory, and yet his work has remained largely undiscovered and often misunderstood.
AN ALMOST-FORGOTTEN THEORY
Hurst published two seminal works: The Profit Magic Of Stock Transaction Timing, followed a few years later by a workshop-style course that was called the Cyclitec Cycles Course (now available as JM Hurst’s Cycles Course). A number of enthusiastic advocates, prominent traders, and writers proclaim Hurst as the “father of cyclic analysis” and confirm the efficacy of the theory (including the late Brian Millard, who wrote several books about Hurst’s theory), but why isn’t it better known and more widely used by technical analysts? There are two possible reasons:
- First, Hurst’s cyclic theory is not easy. While it is beautiful and elegant in its essence, it is not a simple theory to understand or apply. The Cycles Course is more than 1,500 pages long, and most people take several months to work through it.
- Second, although the theory presented in both the Profit Magic book and the Cycles Course is the same, there is a vitally important distinction between the analysis processes presented in them. Hurst claimed his success on the basis of the process presented in the Cycles Course, whereas many people read the Profit Magic book and go no further, with the consequence they never discover the more effective process presented in the Cycles Course.
HURST’S CYCLIC THEORY IN A NUTSHELL
Hurst defined eight principles which, like the axioms of a mathematical theory, provide the definition of his cyclic theory.
The Eight Principles Of Hurst’s Cyclic Theory:
- Commonality: All equity (or forex or commodity) price movements have many elements in common (in other words, similar classes of tradable instruments have price movements with much in common)
- Cyclicality: Price movements consist of a combination of specific waves and therefore exhibit cyclic characteristics
- Summation: Price waves that combine to produce the price movement do so by a process of simple addition
- Harmonicity: The wavelengths of neighboring waves in the collection of cycles contributing to price movement are related by a small integer value
- Synchronicity: Waves in price movement are phased to cause simultaneous troughs wherever possible
- Proportionality: Waves in price movement have an amplitude that is proportional to their wavelength
- Nominality: A specific, nominal collection of harmonically related waves is common to all price movements
- Variation: The previous four principles represent strong tendencies, from which variation is to be expected
In essence, these principles define a theory that describes the movement of a financial market as the combination of an infinite number of cycles. These cycles are all harmonically related (their wavelengths related by small integer values) and their troughs are synchronized where possible, as opposed to their peaks. The principles define exactly how cycles combine to produce a resultant price movement (with an allowance for some randomness and fundamental interaction).
Perhaps the most distinguishing feature of Hurst’s cyclic theory is that it considers a combination of many cycles acting simultaneously upon price, rather than identifying and analyzing a single cycle. One of the consequences for most cyclic theories (which consider cycles in isolation from each other) is that cycles often seem to “disappear.” By contrast, cycles never disappear according to Hurst’s theory, although they may at times be less apparent because of the way in which cycles combine.
PHASING ANALYSIS
The analysis of financial price movements performed upon the basis of Hurst’s theory is referred to as a phasing analysis because it is a matter of determining the current phase of as many cycles as possible. The phase of a cycle is an indication of where that cycle is in its movement, more easily understood as how long it has been since the last trough. Because cycles are cyclical, if we know how much time has passed since the last trough, we can estimate how soon the next trough will occur, and whether the cycle under consideration is influencing price in an upward or downward direction.
Phasing analysis is the key to working with Hurst’s cyclic theory. There are many other important aspects to the theory (such as the nominal model that we are working with, and the trading methodology we apply), but at the heart lies the phasing analysis.
PROFIT MAGIC VS CYCLES COURSE
The Profit Magic book has become a classic, probably because it promises to help the reader understand the movements of financial markets. However, the book presents a form of analysis based on a largely mathematical approach and doesn’t result in the application of the full theory.
But in Cycles Course, the full theory is explained in detail and a different approach to the analysis is presented. This analysis process is the tour de force of Hurst’s work. It is an irony that many enthusiastic readers of Profit Magic never progress to a study of the Cycles Course, because although the theory remains fundamentally the same, it is the different line of attack to the analysis that provides the key to unlock the profits of the theory and delivers on the promise made in the Profit Magic book of using cyclic analysis to truly understand the markets.
THE PROFIT MAGIC APPROACH
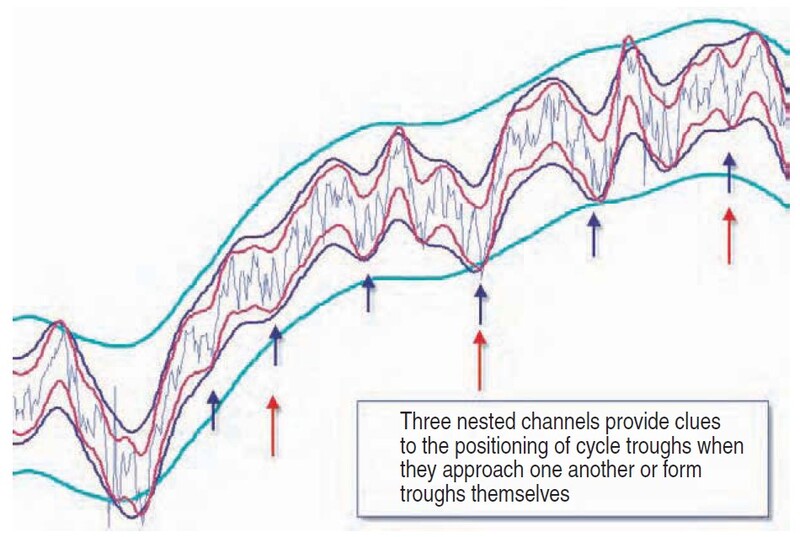
I describe the phasing analysis approach that Hurst presented in Profit Magic as “mathematical,” because it requires the plotting of several calculated displaced moving averages that are inflated to create constant depth channels around price called Hurst envelopes. These channels are nested, and where they approach one another (or themselves form a trough in their shape), a trough of the cycle (on which the channel is based) is positioned (Figure 1).
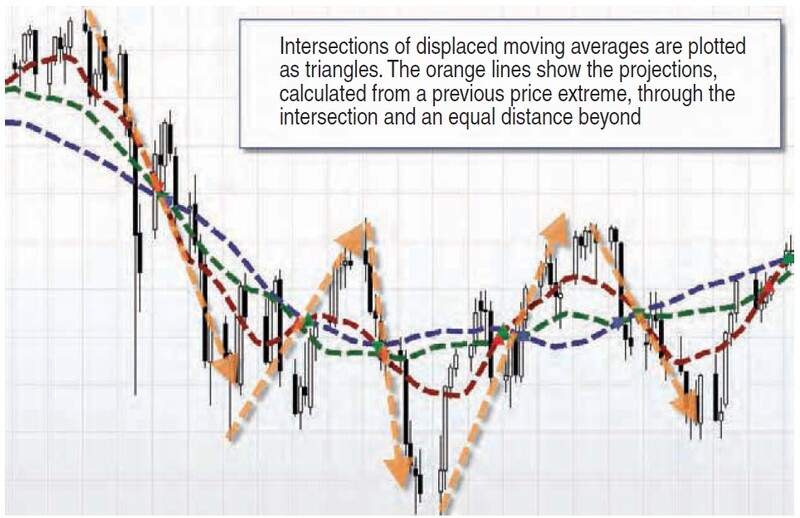
This provides a basic phasing analysis, and then moving averages are used to create projections. Because the moving averages are displaced back in time, they need to be extrapolated forward to points of intersection that provide the projections for future price movement. Figure 2 illustrates how well these projections work with the benefit of hindsight. Figure 3 demonstrates the potential weaknesses of the approach.
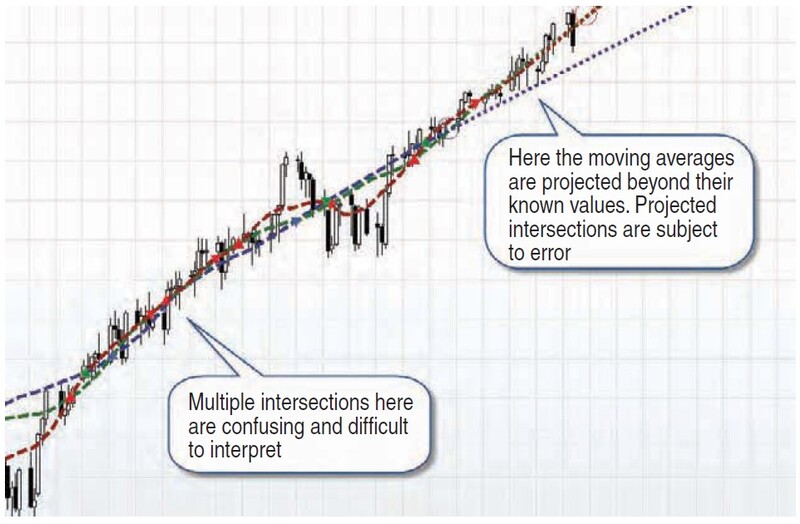
So two vital conditions must be met for this process to work for a trader (without the benefit of hindsight):
- The market needs to be exhibiting well-defined cyclic action (which is a consequence of the total cyclic picture)
- The projections are only as good as the accuracy of the extrapolation of the moving averages.
There are times when these conditions are met and the process works well, but there are also times where the conditions are not met. And so this process doesn’t begin to tap into the true power of Hurst’s cyclic theory.
Advanced Books and Courses on Market Cycles & Timings


PHASING ANALYSIS IN CYCLES COURSE
In Cycles Course, Hurst advocated a different analytical approach, a process that is simple in essence and based upon a form of pattern recognition and the application of an advanced (hopefully) human brain to the resolution of complex dilemmas. The pattern recognition approach involves three stages:
- Entry stage: First of all, the analyst identifies major troughs (“visually evident” troughs because they can be seen clearly) of the longest cycle that appear to be present in the data (Hurst called this the dominant cycle). If a particular expected trough is not apparent, or there is ambiguity in the positioning of the trough, the positioning of this trough is postponed until the analyst has more detailed information.
- Extension stage: The analyst then considers the next shorter cycle in the cyclic model and identifies the troughs of that cycle using the previously positioned troughs of the longer cycle as anchoring points. The positioning of shorter cycle troughs often resolves the positioning of the longer ones, and so the analyst is constantly moving between the cycles but moving from the longest (dominant) cycle down to the shortest cycle.
- Completion stage: Having resolved the shortest cycle visible in the data (the five-day cycle if the trader is working with daily data), the analyst reverses the direction of the process and resolves the position of all the longer cycles.
It is this different approach that provides the true key to Hurst’s cyclic theory because it presents a complete cyclic model; it informs the analyst of the phasing of all known cycles, not merely the phasing of one or two. By understanding the complete picture (as complete as possible, given limitations on available data), the analyst can trade according to how the cycles combine to influence price.
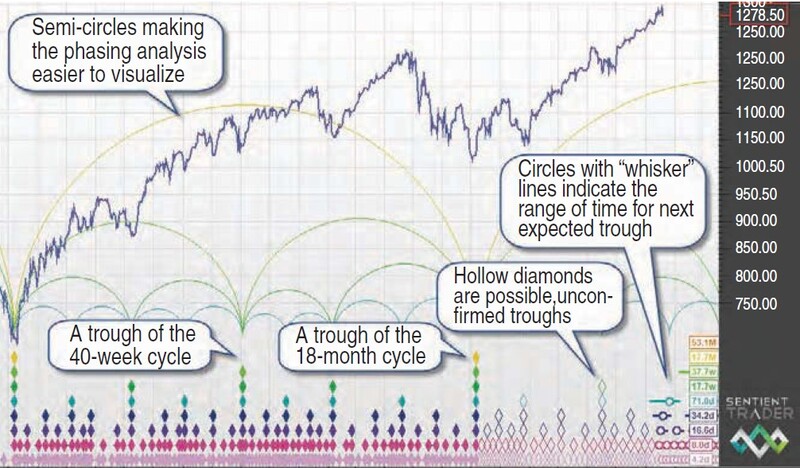
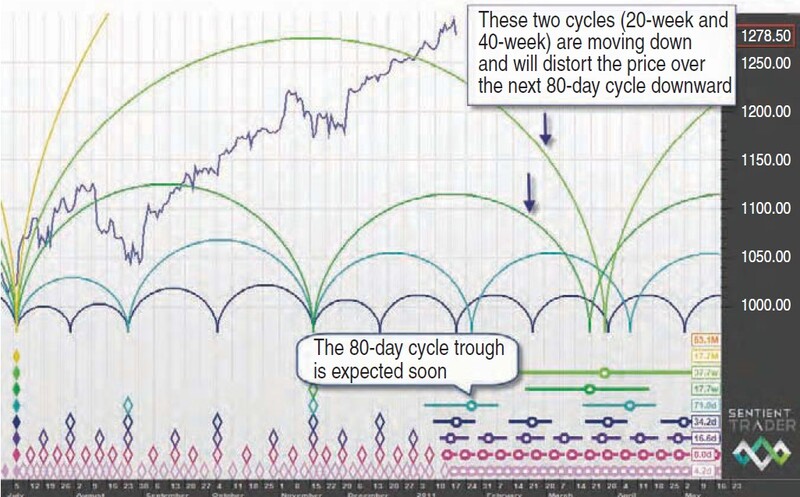
Having performed a phasing analysis, the results are plotted on a chart using a notation system proposed by Hurst involving the placing of diamonds beneath the price to represent the troughs of the various cycles. The higher the pile of diamonds, the longer the cycle that is forming a trough at that point (Figure 4). So what can we expect going forward? Take a look at Figure 5.
As presented in Cycles Course, Hurst’s cyclic theory is a powerful analytical tool that can lead to consistently profitable trading decisions. I hope this article will encourage you to explore further and embark upon a journey that could change the future course of your trading in a profitable way.
- David Hickson is the creator of Sentient Trader, software that analyzes and trades financial markets, according to the full cyclic theory of JM Hurst.