Trading Articles
Going Long Vs. Going Short By Zvi Benyamini

There’s a world of difference between uptrends and downtrends. Here’s a look at different setups and how you can use them to succeed in long and short positions. When I first began selling short a few years back, I didn’t do very well. I was stopped out of trade after trade, and I kept missing out on the best opportunities. At first I didn’t understand what was wrong: I was using the exact same methods that I had used successfully to go long, and simply reversed the rules and setups. Why wasn’t it working?
At some point I realized this was a mistake. Why? Because if you examine the charts of uptrends and downtrends carefully, you will see a world of differences between them. Understanding these differences is crucial to successful short-selling. I would like to demonstrate a few of the differences between common chart patterns in uptrends and downtrends. I will show how they affect my entry setups, stop placement, and profit-taking when going short, compared to going long.
#1: Downtrend Pullbacks
In an uptrend, pullbacks are usually weak and shallow compared to the rallies. Pullbacks in downtrends, on the other hand, tend to be much stronger and deeper. So if we try using the same entry rules for going short on pullbacks, we are likely to miss out on the best trades. We need two different sets of entry rules: one for buying pullbacks in an uptrend, and one for shorting pullbacks in a downtrend. The “buying rules” should avoid strong pullbacks, while the “shorting rules” should allow them.
To demonstrate this point, let’s look at a few examples of pullbacks in both uptrends and downtrends. Figure 1 shows two pullbacks in an uptrend in gold futures. In the first pullback, we can see that volume is low, and daily ranges become narrow, especially near the end of the pullback. This means that selling pressure is weak. The downward progress is slow and uneven; most days close well off the low price of the day, and the entire pullback retraces only half of the previous rally.
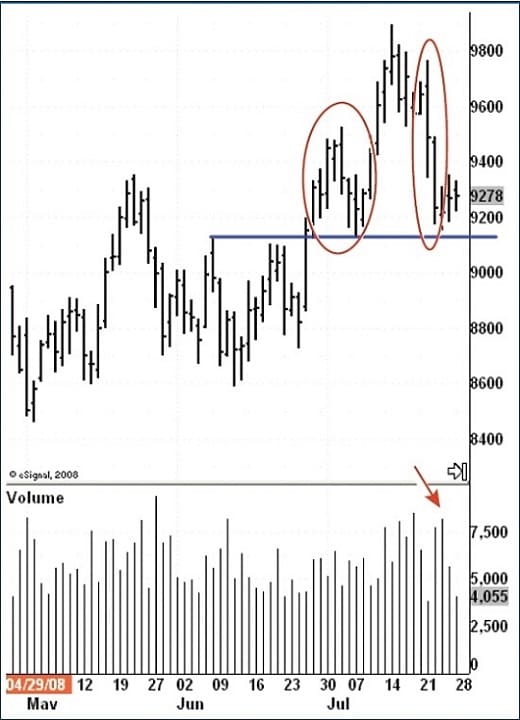
The second pullback, however, is much deeper than the first, giving back all of the gains made in the previous rally. Volume is high and daily bars are wide, closing near the low of the day. This suggests that a notable supply of gold is being offered. Such a strong pullback in an uptrend is a warning sign. In the case of gold, this strong pullback marked the beginning of a major decline in gold prices to below $700.
Now, let’s take a look at a typical pullback in a downtrend. Figure 2 shows a pullback in the falling euro currency. Note the relatively high volume and wide-range bars. In particular, look at the last two days in the pullback: they are the widest bars on the chart to that point. This type of a strong rally, fueled by short-covering, is common in downtrends. In addition, note how prices return all the way back to the previous high. This too is quite common in downtrends.
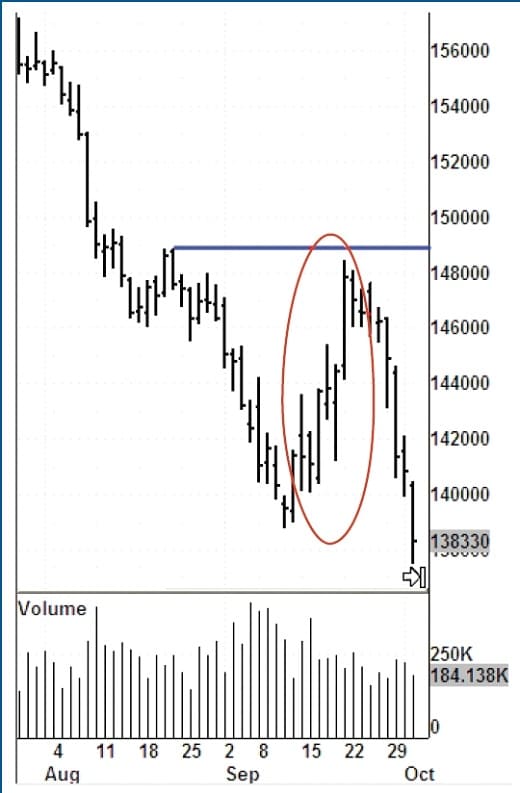
Unlike the case of gold, the strong euro pullback is not a warning sign at all. In fact, a strong pullback stopping at a previous high is an excellent shorting opportunity, so our shorting rules should allow us to enter the trade. Stepping in and selling short at this point may be psychologically difficult because the market seems strong — then again, good trading often is. The strength of pullbacks in a downtrend affects not only how we enter shorts, but how we exit them. Profits on shorts should be taken more quickly than on longs, since any open profits are held at much greater risk. If we do choose to hold onto a short position through a major down move, stops must be kept looser than on longs, and we must not be shaken out by sharp countertrend moves.
Suggested Books and Courses About Price Action
#2: Pauses In Selling Are Common
In an uptrend, buying pressure during rallies is relatively even. Sudden loss of buying pressure is a warning sign and may be a good reason to get out of a long position. In downtrends, on the other hand, temporary pauses in selling are rather common. Therefore, unlike longs, a pause in selling is no reason to exit shorts. As long as the downtrend remains intact, we should hold onto the position patiently, and wait for the down move to resume.
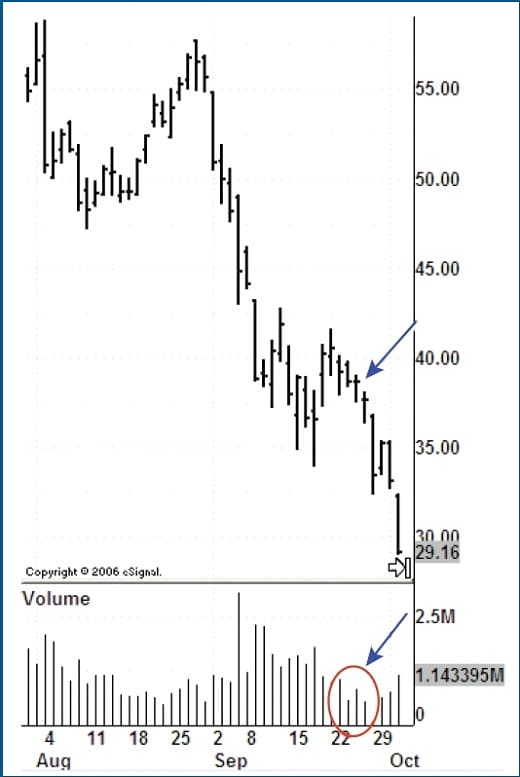
For example, take a look at the rally in Figure 1, following the first pullback: daily ranges and volume expand considerably, showing increasing buying pressure by new participants. In contrast, see the pause in selling shown on the chart of Oil States International, Inc. (Ois), in Figure 3. Note the series of narrow-range, low-volume days. There is little downward progress as the stock attempts to hold. However, the down-trend remains intact and eventually the stock collapses. See also how far Ois continues to fall on relatively low volume: The opposite situation in an uptrend would be uncommon.
#3: Tops Are More Volatile Than Bottoms
At bottoms, the market is usually quiet. Daily ranges are narrow and volume is low, representing low public interest. Tops, on the other hand, are more volatile: daily ranges are wide and volume tends to soar as public interest is highest. Thus, when going short at a top, we are entering the position at a time of high volatility, and this requires a different approach than entering at a time of low volatility. From a technical standpoint, shorting tops requires looser stops. When a market explodes to the upside out of a dull period, it usually doesn’t look back. But at the top, the market will jump up and down several times before finally turning, and we must allow for these attempts without getting stopped out or jumping off the position too soon.
At the same time, to be shorting tops requires more accurate entries: when you buy in a quiet market, it doesn’t matter if you get in a little late or wait for additional confirmation. But in a volatile market, if you don’t enter near the edge, your risk grows considerably and profit potential drops. From a psychological standpoint, acting in high-volatility markets is also more challenging. It requires a greater level of skill and discipline in order to stay with the plan and not be affected by market noise.
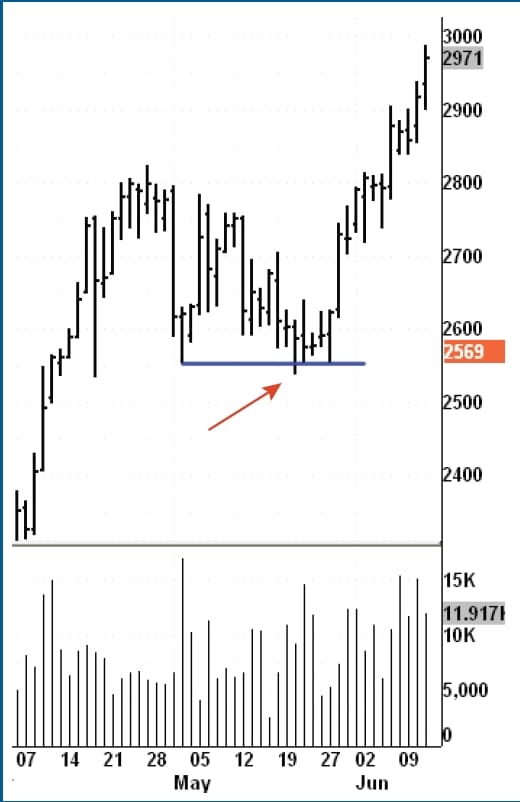
Here’s one example: false breakouts, one of my favorite setups. False breakouts, both to the upside and the downside, provide good trading opportunities; if a breakout fails, the market will often turn the other way. In an uptrend, we will look to buy a stock after a false downside breakout, and vice versa in a downtrend. When buying a stock after a false downside breakout, you should place a tight stop below the low. Once the move has started, it should not come back, which it didn’t in the chart of cocoa futures in Figure 4. Repeated false breakouts, as seen in the chart of Automatic Data Processing, Inc. (Adp), in Figure 5, are usually a sign that a stock is unable to take off, and warn us against buying.
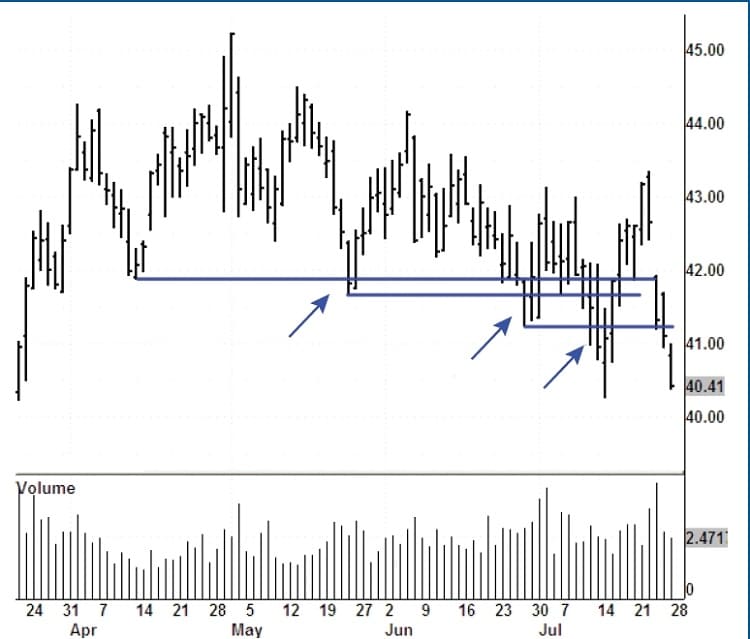
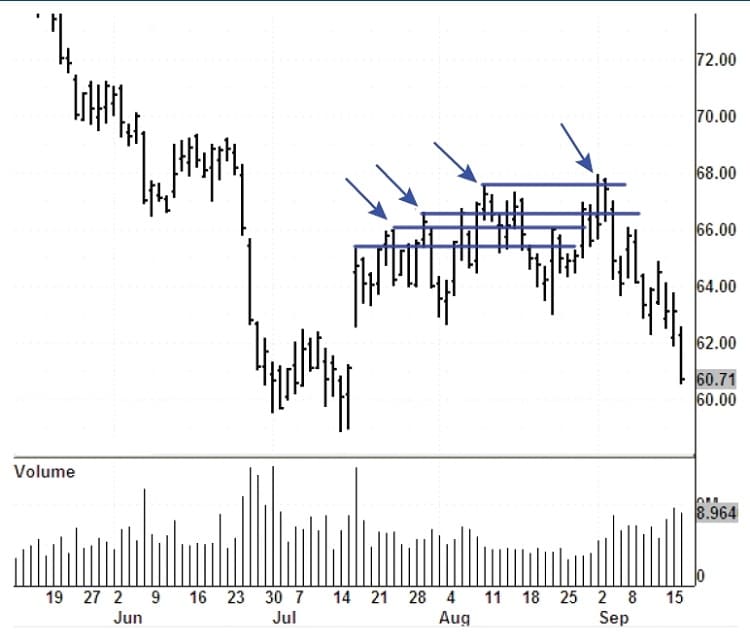
False upside breakouts, on the contrary, will often repeat several times before finally turning down. These repeated attempts, as can be seen on the chart of United Technologies Corp. (Utx) in Figure 6, may look strong at first, but have little or no follow-through. Therefore, when shorting a false upside breakout, the stop must be relatively loose in order to leave room for additional unsuccessful attempts at the high. In addition, once short, the position should not be aborted because of a single, seemingly strong, up bar.
Treat Longs And Shorts Differently
Selling short is an important part of trading, and any serious trader should be comfortable with it. Selling short is not the same as buying, and each must be treated differently. Also in this article I have discussed three differences between uptrends and downtrends, and shown how to take them into account in your trading. Whatever setups or indicators you use in your trading, they too are affected by the differences I have studied, and it is your job to find out how. Make sure you have two trading plans, one for going long and the other for going short.
Test each plan separately under the relevant market conditions. Do some of your setups work better in uptrends, others in downtrends? Should you use different indicator settings or entry rules? Test these questions for yourself on your individual trading methods. By doing this you will be taking an important step toward becoming a successful short-seller and a successful trader.
Zvi Benyamini is a private trader. He is a trading student of David H. Weis and Alexander Elder. His professional background is in system engineering.