Trading Articles
Trend-Spotting In The Markets By Rick Martinelli

Most stock market data can be thought of as combinations of trends of various lengths and directions, and cycles of various frequencies and durations. As a result, many techniques have been developed to discern when a particular stock is trending or cycling. Let me describe a simple approach to trend-spotting that is based on the idea that correlations in price differences translate into trends in prices.
TRENDS AND CYCLES
Consider exactly what constitutes a trend at the smallest level. If we assume the minimum number of consecutive prices required to spot a trend is three, there are four possible arrangements of three prices, as shown in Figure 1. In case A, prices show two successive increases and are in a short uptrend, a microtrend upward. Case B shows two successive decreases, so it is a downward microtrend. Cases C and D show no trend, but instead are interpreted as small portions of cycles, or microcycles.
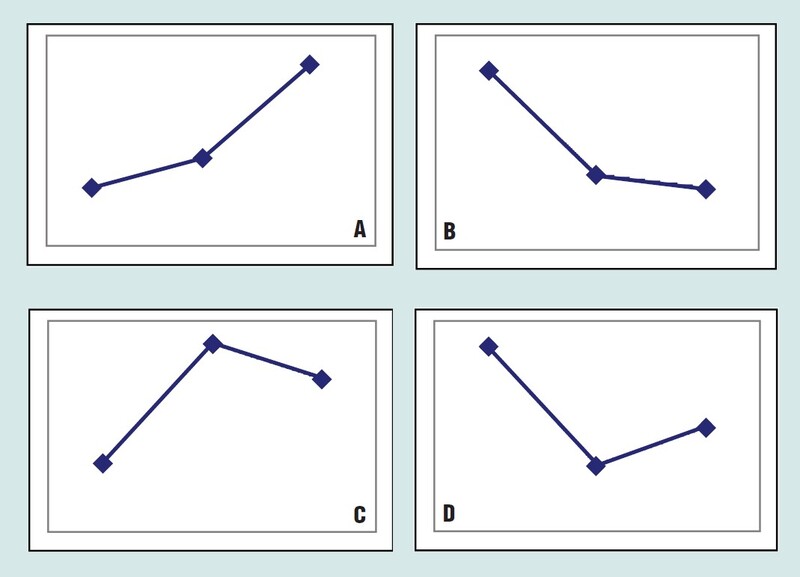
If values P1, P2, and P3 are assigned to the three consecutive prices, then in the first case, P2 > P1 and P3 > P2, while in the third case P2 > P1 but P3 < P2.
Similarly, the other two cases may be characterized by their corresponding price inequalities. But all of this information may be summarized instead by considering the price increments D1 = P2–P1 and D2 = P3–P2. Then for the first two trend cases, we see the product as D1*D2 > 0, while for the cycle cases D1*D2 < 0 — that is, the product of increments is positive for a trend! In addition, the value of the product gives a rough indication of the amount of price movement in the three points, the intensity of the microtrend.
TRENDS AND CORRELATIONS
Now consider a series of daily stock prices represented by x(k) for k = 1 to N, where N is the total number of days. Its series of price changes, known as its increment series, is
- z(k) = x(k) – x(k-1)
Next, define a new series a(k) as the product of consecutive increments — that is,
- a(k) = z(k) z(k-1)
If a(k) is positive, the series x(k) is in a microtrend on day k and, conversely, a negative a(k) indicates a microcycle. Any series of increments z(k) has an average M and standard deviation S. If the original series z(k) is replaced everywhere with (z(k)–M)/S, then the resulting series has mean zero, variance 1, and is said to be normalized. For a normalized series, the (one-day) autocorrelation coefficient (AC), defined by
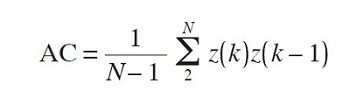
is a statistic indicating the similarity between itself and a version of itself shifted back in time by one day. But this is also the AC for the series z(k) before it was normalized, so that the AC for the original increment series is just the average of our a(k)’s:
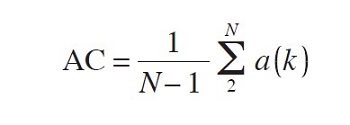
This is the connection between correlations in the increments and trends in the data. The a(k)’s are called the correlation atoms of the series z(k), so named because they constitute the smallest possible pieces of correlation in z. The AC takes values between -1 and +1, where +1 indicates complete correlation, -1 indicates complete anticorrelation, and AC=0 means no correlation at all. See the sidebar, “Spreadsheet To Calculate Correlation Atoms.”
Suggested Books and Courses About Forex and Stock Trading
HERE’S AN EXAMPLE
The result given suggests that stocks with a large, positive AC should contain more trends than other stocks. So on March 24, 2010, I scanned a large database of stocks and sorted them by their ACs. At the top of the list was WHI with a coefficient of AC = 0.501. Figure 2 shows one year of the average price of WHI, ended March 24, 2010, where the average price is calculated over the daily open, high, low, and closing prices.
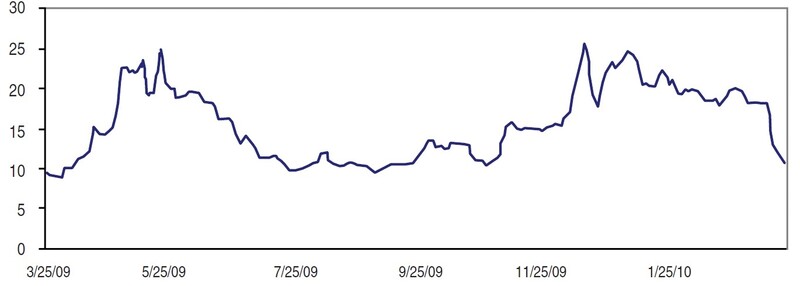
Figure 3 shows the corresponding correlation atoms for WHI, where the overall ratio of positive atoms to total is 0.628, indicating almost twice as much trending as cycling during the year, in agreement with its large AC value.
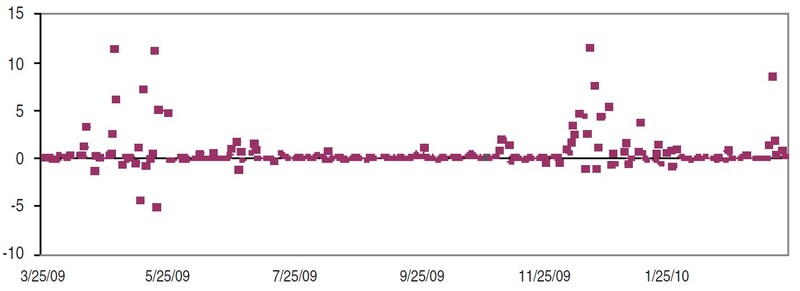
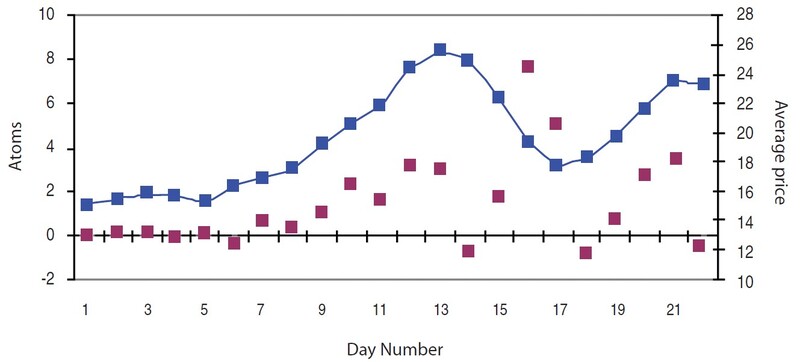
Rapid price increases during May and December in Figure 2 can be seen as a scattering of large-valued atoms in Figure 3, in contrast with the middle section from July to November, which has much smaller values distributed around zero. In Figure 4, prices and atoms (red dots) are graphed together for the December data, a 22-day period ended December 29. From the atoms we can read off the behavior of the data. The positive atom at point 7 indicates the start of a seven-day trend that ends with a cycle indicated by a negative atom on day 14. The subsequent three-day downtrend is accompanied by three positive atoms and ends with a cycle indicated by the negative atom on day 18. Another uptrend begins after that.
OTHER USES
We have seen that correlation atoms are effective indicators of trends and cycles at the smallest level. To find longer trends, you could apply a moving average to the correlation atoms, yielding a smoother, yet responsive indicator. Or a watch may be set for two or more consecutive, positive atoms. The atoms may even be useful to cycle traders; longer cycles may be detected as several consecutive positive atoms interrupted at regular intervals by one or more negative atoms, similar to the behavior in the latter part of Figure 4. In addition to finding trends, the atoms and/or their averages may be used in prediction schemes. We have employed a 21-day average in our Kalman filter predictor successfully; predictions are ignored if the average of the increment atoms falls below a specified level.
Rick Martinelli works with Haiku Laboratories.