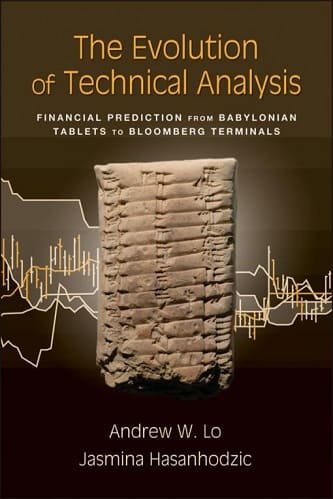
The Evolution of Technical Analysis: Financial Prediction from Babylonian Tablets to Bloomberg Terminals
$16.88
| Author(s) | , |
|---|---|
| Format |
|
| Pages |
178 |
| Published Date |
2010 |
In The Evolution of Technical Analysis: Financial Prediction from Babylonian Tablets to Bloomberg Terminals, MIT’s Andrew W. Lo details how the charting of past stock prices for the purpose of identifying trends, patterns, strength, and cycles within market data has allowed traders to make informed investment decisions based in logic, rather than on luck.
Introduction:
Technical analysis—the forecasting of prices based on patterns in past market data—is something of a black sheep in modern economics. Some skeptics view it as kissing cousins with sleazy speculation or gambling, while others regard it as a relic that is only slightly more sophisticated than the reading of chicken entrails. Proponents of quantitative analysis, who take physics as the ideal model of how economic science ought to look, view technical analysis as antiquated and contrived in its very foundations. They demand mathematical proofs of its validity and dismiss as exception bias the strong betting averages and impressive bottom lines of successful technicians. We make it no secret, then, that we regard technical analysis as a legitimate and useful discipline, tarred by spurious associations and deserving of further academic study.
Some of this skepticism is understandable in light of the historical origins (and occasional abuses) of technical analysis. Many of its methods come down to us from the days before computers and the number-crunching-intensive theories they made possible, and not all of its methods have been thoroughly explored within the quantitative frameworks now available. Many terms and concepts in technical analysis can seem abstruse or outmoded; it is easy to see how a discipline that involves eyeballing charts for patterns with names like “head and shoulders” and “cup with a handle” might seem at first blush more akin to astrology than science. However, many of these are merely heuristics developed in the precomputer age when calculating a simple statistic was a formidable task. For instance, the 10-day moving average became a fixture of technical analysis not because it was optimal, but because it was trivially easy to compute. Indeed, there are many such concepts in “classical” technical analysis that could benefit from quantitative reformulation.
Ultimately, however, both technical and quantitative analysis serve similar purposes: They both attempt to predict the future based on models of the past. One is statistical, the other is intuitive. Whereas a quant minimizes a sum of squared residuals to find the best-fitting line given the data, a technician estimates it by looking at the charts, searching for tell-tale patterns, and inferring the thoughts and feelings of other market players. Both approaches have merit. This is not to say that they are equal; clearly, quantitative methods have won hands down, dominating the investment industry because of their demonstrable value-added. But technical analysis is surprisingly resilient and persistent, and in some corners of the financial industry—such as the trading of commodities and currencies—it is still the dominant mode of analysis. This state of affairs suggests that technical analysis may have something to contribute, even to the most sophisticated quant. Fortunately, a slow but sure reconciliation is underway.
Though big strides have been made throughout history and in recent years toward developing a more systematic approach to technical analysis, technicians remain ostracized to this day. For evidence, look no further than the Financial Industry Regulatory Author ity’s official recognition of the Chartered Market Technician designation, which occurred only in 2005. Part of the reason is that technical analysis is often associated with the speculators, bear raiders, and market cornerers of previous eras. As Tony Tabell, a veteran technical analyst and an heir to the technical brokerage business founded by his father Edmund Tabell in the 1930s, explains:
It’s hard to visualize unless you’ve talked to people who were involved how difficult this was in the atmosphere of [the] 1930s and 1940s. The entire brokerage business was a basket case. Volume on the NYSE was under a million shares. This was the 1930s, the Great Depression, nobody had any money, and if they did, they were very leery about investing. Furthermore, technical analysis had been associated with the excesses of the 1920s. All of the various Securities Acts were designed to get rid of the manipulative market operations that had characterized the ’20s. Since technical work to a great degree (certainly point and figure charts) had been originally conceived as a means of detecting pool operations, confessing that you were involved in technical work at that point was sort of equivalent to confessing that you were some kind of a low-level criminal. I saw some [of ] this, because the remainder of this attitude was still kicking around when I started in the business in the 1950s, but I can imagine how incredible it must have been in the ’30s and ’40s.
Contents:
- Ancient Roots
- The Middle Ages and the Renaissance
- Asia
- The New World
- A New Age for Technical Analysis
- Technical Analysis Today
- A Brief History of Randomness and Efficient Markets
- Academic Approaches to Technical Analysis
The Evolution of Technical Analysis: Financial Prediction from Babylonian Tablets to Bloomberg Terminals By Andrew Lo, Jasmina Hasanhodzic pdf
8 reviews for The Evolution of Technical Analysis: Financial Prediction from Babylonian Tablets to Bloomberg Terminals
Clear filtersOnly logged in customers who have purchased this product may leave a review.





Emmitt Johnston (verified owner) –
As the title suggests, this is a fun read only if you have an interest in the evolution, history, and origin of technical analysis.
Maximo Moran (verified owner) –
The book contains a thorough list of citations, complete notes and bibliography. Its well documented.
The authors are MIT researchers, so it would be nice to think they would allow a peer review process and not have “their friends” boost ratings, even if that is common with some books.
The book is quite cogent and educational, if you are interested in where TA comes from and where its heading, this is a fine quick read.
Laila Nolan (verified owner) –
This book is a poor compilation of quotes and summarized excerpts from several other books, especially from Alex Preda’s studies on socio-economics. I never seen before so many quotes attributed to a single author.
Could make for a mediocre history of trading class, but doesn’t bring any insight on the technical analysis.
Sariyah Castillo (verified owner) –
I eagerly awaited the release of this book. I’ve seen the authors present other work at professional conferences or online in other settings, and my expectations for this book were very high. Maybe I just expected too much.
The Good:
This is a pure history book. You will not find any guidance for application of technical analysis here.
The authors regard technical analysis with sufficient objectivity to acknowledge its potential value.
If you do not have an MBA in Finance, the overview of the history of EMH and Random Walk as two related yet distinct theories is worth the price of the book. The authors are steeped in the theories of modern finance and their discourse thereon is brilliantly written. This was by far my favorite part of the book.
The Bad:
The authors freely admit they are writing about technical analysis from the perspective of outsiders (though they work together managing nearly a billion bucks using quantitative and possibly even technically based strategies, and are regarded by technicians as the tip of the spear among academics advancing the cause of TA). If you are a well-read technician, perhaps a professional one, you will not find any new revelations in the historic review of technical analysis. You probably have been exposed to the important historic information in the classics already on your technician’s bookshelf. More importantly, I was disappointed the material was not better organized, and that the essence of certain historic figures’ body of work were not presented in a more unified, coherent way.
The Ugly:
If you are not a well read technician, you may not realize how jumbled this book can be.
The other disappointment of the work is that an enormous amount of exposition is devoted to discussing the development of commerce, the discovery of price records, and the supposition that since such records are found, it is natural to assume they were used for technical analysis. However, only the surface is scratched here. Lastly, the authors tend to give undue emphasis to various categories of non-technicians’ disdain, ostracism of, disregard for, and general ignorance of technical analysis. They use much more polite language in citing research that discredits the EMH.
In conclusion:
This book represents a very, very important first step in assembling the history of technical analysis into a single volume. I am grateful to the authors for having undertaken it. However, it is not a “definitive” or “authoritative” reference that blocks out the need for others to write history books in the same vein. It can be used either to round out some missing history details for you, to identify some research you might have overlooked, or to give you an idea of the role of price in the grand arc of economic history. The authors are to be commended for creating what may be the first pure-play history book on technical analysis. Hopefully more will follow.
Yehuda Frederick (verified owner) –
Expected more than got…
Sadie Tyler (verified owner) –
Finance professor Andrew W. Lo and research specialist Jasmina Hasanhodzic present a history of finance and of the development of business and stock markets. Their informative research connects the commerce of ancient times to modern practices, theories and analytical methods. getAbstract recommends this sweeping and engaging history to professionals curious about how business evolved and to students majoring in economics, finance, history or related disciplines.
Celeste House (verified owner) –
AAAAAA+++++++
Leif Cox (verified owner) –
Technical analysis is the ugly duckling of the financial world. It is widely sneered at and its advocates tend to be inhibited in their advocacy.
This book acts as both a history of, and an argument for, technical analysis. As far as the history element is concerned, it is far too detailed. I cannot imagine what sort of reader would have any interest in such micro-information. I have little doubt that it is well researched, but the early chapters had me thinking of that famous Wendy’s advertising strapline – “Where’s the beef?”
The book presents a reasonably robust argument for the strengths of technical analysis, citing frequently the work of one of the authors, Lo. In my view, though, there is a yawning gap in its failure to consider the evolution of both quantitative analysis and high frequency trading. Quant funds are equipped with computational power, trading software and financial and non-financial databases vastly in excess of anything available to the typical technical analyst. Since these resources are capable of matching anything a technical analyst can do and of executing the prescribed trades almost instantaneously, what scraps are left on the table for the everyday technical analyst?
The omission of this issue is what makes me reluctant to award the fourth star. However, I (mostly) enjoyed reading the book and I suspect that I shall dip back into it from time to time, so the fourth star stands.