Smarter Investing in Any Economy: The Definitive Guide to Relative Strength Investing
$16.20
Smarter Investing in Any Economy: The Definitive Guide to Relative Strength Investing will show you how relative strength strategies allow you to invest successfully in both bull and bear markets. Even in a market downturn, something is always going up. Relative strength will help you pinpoint that stock, currency, or commodity that s on its way up. Recent advances in computing capability and the widespread availability of ETFs have now opened up relative strength strategies to virtually any investor. Relative strength has been widely used for years by financial institutions; however, it was never accessible to individual investors because of complex custom programming requirements. Computing advances, coupled with new ETFs that limit risk have made relative strength a viable strategy for long-term investors and day traders alike. Carr has broken down his technique to the level that any Microsoft user can implement his strategies successfully.
Author’s Note:
I’m excited to give you a “behind the scenes” look at the key behind many of my successful trading systems — my relative strength (RS) indicator. I want you to know that while Smarter Investing took about three months to write — it took about 18 years to research. It was a few decades ago, in 1990, when I first came across the idea of RS — and I immediately knew it made sense. For those unfamiliar with relative-strength trading, I’ll just say now that the idea is simply to buy stocks that are going up and avoid stocks that are going down. It really is as straightforward as that.
However, in 1990, there wasn’t a lot of information about RS available. Access to the indicator required an expensive subscription. To top it off, I couldn’t find any formulas for RS. So I started working on my own. After a few months, I had an idea that seemed like it would work, but the formula needed to be refined. Then, in October of that year, I read that the Royal Swedish Academy of Sciences awarded the Nobel Memorial Prize in Economic Sciences to three economists who had studied the stock market. One of the economists was Dr. William Sharpe.
As I read about his research, I realized the formula I was working on was something known as “beta,” one of the concepts the Nobel Prize recognized. Beta is found with a linear regression that compares the stock’s price moves with the changes in the S&P 500. I cover the calculations in detail later in this book. This news didn’t discourage me. It actually opened up a whole new world, which you’ll read all about in this book.
That’s because I now knew there was academic research that could help me discover how to beat the market. Remember, this was the early 1990s, before the internet, so progress was slow to say the least. I had to work through libraries to access academic papers and journals. It could take months to get individual papers! And sometimes I got my hands on research that didn’t help me an iota. But finally, in 1999, I uncovered a paper that had been published in 1993 proving RS worked. And it provided a simple formula. From there, I found other papers, some dating back to the 1940s. But I realized there was a clear problem in all this research…
There was nothing explaining how to use RS to the average, individual investor. That’s why I decided to write this book. This book was released in May 2008, as the stock market was beginning the worst bear market since the Great Depression. Test results shown in the book run through December 31, 2007, and I have to say the results shown in the book are impressive. For example, this table is the same one you will see in Part 3. All of the rules are described in the book, by the way.
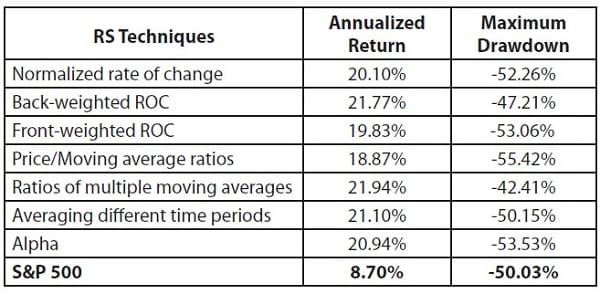
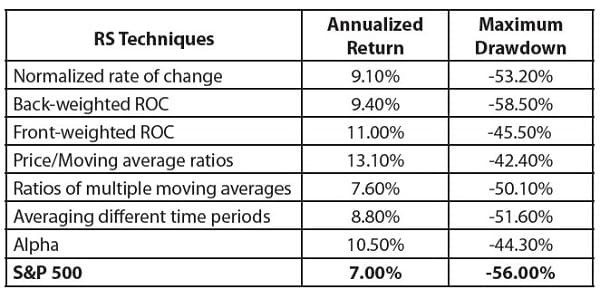
These tests use different definitions of RS, and each definition beat the market (the S&P 500), based on the annualized return. As you can see, though, the results show that an RS strategy can suffer steep losses. The Maximum Drawdown column shows the largest loss in the portfolio over the 17-year test period. Yes, the maximum drawdown is high — and this is a problem with RS. But there are ways around that problem as I explain in Part 4 of the book. Of course, these results don’t include the bear market, which was already underway when the book appeared. So every reader should ask an important question before they get to the first page of the text: What happened in the bear market? I wanted to provide you with that information, so — to see if these RS strategies have worked since the 2007 publication — I ran new tests. These tests were all run the same way the original tests were run, except for the dates.
The start date is January 1, 2008, and the end date is January 15, 2018, which allowed for the longest test period while meeting this new publication deadline. Results are in the table at right. The results show that RS still works in the long run — even throughout a bear market. All of the formulas still beat the market. Of course, all of the results continued to endure large drawdowns. So risk management is central to implementing an RS strategy, and that’s why I have spent years working on that.
In the time since it’s been published, my research has continued. It’s not surprising that if I wrote this book today, it would include information I didn’t know a decade ago. After all, I do use the most up-to-date research in my current work and share that research whenever possible. But the main point remains this — relative strength works, and it works well. And if you understand it, you can use it to beat the market. That’s why I wanted to present this book to you. It has everything you need to get a good grasp of the strategy. I hope you enjoy it and benefit from the details you’re about to learn.
Contents:
- Defining Relative Strength
- Calculating Relative Strength
- Testing Relative Strength
- Managing Your Risk
- Trading Applications
Smarter Investing in Any Economy: The Definitive Guide to Relative Strength Investing By Michael J. Carr pdf
| Author(s) | |
|---|---|
| Format | |
| Pages | 204 |
| Publication Year | 2008 |
17 reviews for Smarter Investing in Any Economy: The Definitive Guide to Relative Strength Investing
Only logged in customers who have purchased this product may leave a review.
Related products


Baker Huang (verified owner) –
By far the best book on relative strength that has ever been written.
Shows a variety of Excel convertable RS types that hit the market
and deliver fewer drawdowns. Super recommendable. Whom Goerke is not enough…
strike here!!!
Francesca Crosby (verified owner) –
All that math. There is no way this book helps anyone who does not have an advanced degree in math. I have been ripped off.
Tristen O’Connell (verified owner) –
I have read this book and fully agree with the comments made by the reviewers except for Mr. Willie Cooper’s comment. The book comprehensively reviews the subject of relative strength investing, one method that has garnered much evidence supporting its usefulness. The book is well organized, and the discussion progresses smoothly from start to finish. Mr. Carr provides the hard evidence to show each method’s efficiency – an impressive task and a most useful value. This book is a significant addition to the study of relative strength investing.
Jillian Humphrey (verified owner) –
With a title like that, you have to wonder if it can possibly live up to such a claim. I think so, and here’s why:
1. He develops his ideas clearly, starting with the rationale behind RS, and its use in top trading strategies, such as Investors Business Daily and Value Line.
2. He then walks you through a variety of approaches (18!) to calculating RS, one step at a time, showing you how each one is calculated, and illustrating these with graphs.
3. Next, he walks you through his tests on RS, based on a broad range of sectors, with each of the above approaches, to show you how he arrives at his conclusions.
4. Along the way, he carefully addresses important questions that every trader must deal with, such as selection criteria, diversification, risk, stops, etc. He backs every point up with his own research, and with references to the key work of others–the academic research, and that of key authors such as Van Tharp and James O’Shaughnessy.
5. Ultimately, he develops this into a full fledged trading program for every kind of market.
Whether you are a systems trader or not, I strongly believe that if you only incorporate the least of his ideas on Relative Strength, you’ll take a quantum leap forward with your trading.
Mohammad Vasquez (verified owner) –
Very good book indeed.
Total guide to smart investing.
Worth the reading.
Definitely the first thing to observe before investing or trading.
Bennett Hendrix (verified owner) –
it’s okay, but a tough read
Yamileth Guerra (verified owner) –
This was a great book with lot of detailed explaination of relative strength and how it can be used towards investing. One big question which was left answered is that do you continue to add more money to an ETF which you have in your current portflio which was ranked 1 at some time, but its not now but is still above the cutoff rank.
Because the book mentions that anytime you should have only 3 etfs in your portfolio. The question is how do you add additional money to the portfolio?
Blaire Powell (verified owner) –
Well written, easy to follow. Not really original but a good review of how to go about designing a relative strength trading system. It is also well referenced and offers plenty of ideas for a reader to individualize their own system.
I re-wrote my review after giving the book a second reading as well as many of his references, and I think understanding it better the second time around.
The only area that could have been more complete would have been in the context of using money market ETF’s and/or short-selling ETF’s, and building a portfolio with low-correlation ETF’s from different asset classes.
Esther McGuire (verified owner) –
This a good book, no doubt about it. I have already been using methods similar to the ones suggested by this book for the last 10 years or so using TC2000-MutualFunds. Surprisingly the author does not even mention this program. It is much cheaper and better than the ones mentioned in the book. You don’t need to go to Excel and do all the work for yourself. But the real problem of this book is the way the mathematical formulas are written. It is very confusing to anybody who knows a little arithmatic. The sign of “equal to” should come on the same line as the line separating numerator and denominaor. When you calculate percantage you multiply the whole formula with 100 and not just one part of it. Those formulas need brackets. When you take an average of two quantities, you add them and divide by two. The author has used the sign of multiplication (*) instead of addition (+). These errors make reading of the book very confusing. I hope the author can correct the formulas in the next edition.
Leland Glenn (verified owner) –
I would probably give this book 5 stars for content and relevance for anyone who wants to use or develop a Relative Strength approach to investing. The writing style and organization of topics covered isn’t up to the same level as it’s a bit jumpy and at times confusing. I read the book twice because I am very interested in the topic and the first read left me confused too much (my fault as I read it very quickly and though the math and different approaches tested are not overly complicated you do have to pay attention). The thought process behind developing a relative strength system is covered pretty extensively with little left out though and that’s the main feature of the book. A bit more information besides the recommended software provider (no longer in business for personal reasons is my understanding), and using an excel spreadsheet to develop and backtest our own system would be appreciated. All that said, the book is very worthwhile about a fascinating investing approach and it seems the author is trying to demystify something for everyday investors willing to understand this approach and put some but not too much time into it once a base or foundation is established.
Zhuri Foley (verified owner) –
This book is a classic, at any market weather. Solid background, with thorough research and reference included, and a good intro into trading system design. An updated version would be welcomed.
Krew Avery (verified owner) –
There is more to relative strength investing than one would think. This discusses the many ways that relative strength can be measured. Formulas are easily reproduced in spreadsheet form for do-it-your-selfers.
Ariyah Hartman (verified owner) –
This is an excellent book. It delivers exactly it sets out to (provide an in depth study of relative strength techniques that can be used by the individual investor) and backs it up with research (the most important part). Mr. Carr seems very educated on the subjects of statistics and ways to test data to reduce bias and optimize the results. This book makes use of graphs and tables in a constructive way to supplement and showcase his points. He also discusses the importance of using an equity curve to determine when a particular investing system should be avoided for the time being (a concept I have not seen in any other investment books I have read). Finally, he presents the reader with a complete trading system that can be updated weekly and provide a diversified portfolio using ETFs.
This book is very useful and opened my eyes to some new concepts I had not considered previously. I wish it were a little longer (175 pages of material) but I did enjoy the fact that the author didn’t add unnecessary fluff. I also wish there were more research involving leveraged instruments besides mutual funds (which I suppose were not available at the time the book was written?). Perhaps the author could put up a blog or website where he could display any additional research findings. Also, as a warning, if you don’t like math and statistics you may not like this book.
Overall, this is a great book that can provide some excellent, researched ideas to the individual investor’s portfolio management techniques.
Kamden Hartman (verified owner) –
Smarter Investing provides a specific strategy to help screen stock choices. I am a newbie to personal investing and found this book very helpful. It is a bit over my head, but want to learn more about investing based on Relative Strength (RS). This book will be with me a long time as there is much to learn. This is a great guide to help understand how RS is important to consider when developing your own personal investing strategy.
Rose Evans (verified owner) –
I bought this book after reading The Ivy Portfolio, in which the authors present an ETF rotation model on various asset classes. There was a reference to this book, stating this book has some interesting ways to calculate relative strength and backtests with relative strenght criteria. I have been doing some backtesting myself on ETF’s in excel, and I was hoping to find similar stuff in this book.
Overall, it certainly isn’t bad, but it could have easily been a better book. The author starts with describing momentum investing and how to use percentiles & ranks to order etf’s/stocks. The second chapter gives more information on the various ways of how to calculate relative strength (9 formulas in total). There is a short introduction to alpha & beta calculations from the MPT, but no details on how to calculate these things in excel/another program.
In the third chapter we (finally) get some tables with his backtestresults, or more precisely: an annualized return & Max DD for eacht RS calculation method. That’s not bad, but I wonder why the author didn’t give more details there. In most books I’ve red on backtesting, the authors go into much more detail on their backtest results. There also some tables following with optimized parameters, for those interested in them.
The end of chapter 3 is much more interesting to me, the authors tests the use of stop-loss and trailing stop orders. Similar to my own backtest results, these stops don’t improve the backtest results. Instead, the make them worse.
Chapter 4: Managing your risk. In this chapter the author adds the standard deviation component to his earlier RS formulas, which results in better risk/reward ratio’s for his backtests, but no higher returns. A nice backtesting idea I’ll try to backtest myself. The author als mentions here the idea of trading your equity curve. The idea is to add a simple moving average to your equity curve as a way to filter your entry signals, so you only take trades as long as your equity curve is going in the right direction. I’m a little sceptic to this thing, as I don’t see how this filter is related to the next stocks/etf’s that are going to rise …
In the final chapter, Trading Applications, I was hoping to get some concrete trading advise. The author is going to test 3 samples in this book (stock market sectors, different asset classes, a bunch of country etf’s) with his RS formulas. So far so good. Then we get a table with the trading rules he’s going to use to test these samples. The author then tells us these parameters are all optimized … He justifies this optiming by saying he didn’t look ahead to see which etf’s would perform the best and then adapt his system to those etf’s. Well, that’s true, but I’d rather have seen his backtest results without any optimizing at all. Now, the only thing I get are his backtest results generated by his RS formulas with optimized parameters. No surprise the backtest results look pretty good …
The rest of this final chapter is choppy, to say the least:
– He tells us how to calculate ATR-stops, but apparently he hasn’t done any backtests with these stops
– There is a reference to a fundamental screen combined with a relative strength criteria (this is a direct copy from O’Shaughnessy his backtests in What Works on Wall Street)
– There is a stock selection criterium from some guy named Charles D. Kirkpatrick, II. A reference (or anything) to this person would have been nice, but there’s nothing that refers to this guy at all.
– The final 3 pages of this chapter go on applying RS to futures. I don’t really know why these pages are added to the book, there is just one short reference to a earlier study on RS applied on futures, nothing from the author himself …
In conclusion: not bad, but it could have been better. For example, “The Ivy portfolio” or “ETF Trading Strategies revealed” by Vomund.
Casey Cantrell (verified owner) –
This book provides a reasonable introduction to the components and issues involved in a proper backtesting template. Care must be taken to read what the author says at face value as very little further discussion is put on critically important concepts.
I cannot replicate the author’s basic backtest results in Table 3.4, Page 97. My CAR is consistently about 8% lower than what the author shows. Now, if it was really that easy to get consistent 20%+ CAR returns since 1990… lets just say I suspect the mutual fund data from CSI via Yahoo is either subpar or the author’s discontinued Monocle II’s data source was better adjusted than CSI’s (or simply flat out inaccurate). For those wanting to remove all doubt, Investor’s FastTrack has the cleanest mutual fund data at the retail level.
Either way, I can’t shake the feeling that using Fidelity Select Sectors (which are actually industries) is data mining. Ever since they came out in the 1980’s, innumerous huckster newsletters and advisory services have popped up providing “sector timing” switching advice for the Select funds, even before there was enough years of history to determine robustness! So from that perspective alone, this book finally provides proof of concept for the last 30-years of Fidelity switching advice and as a bonus, anything post-2008 will act as out-of-sample verification for optimized parameters.
Also, I thought the various relative strength formulas were quite basic and uninspiring, but maybe I was expecting more complexity being used to reading academic papers. I would encourage everyone to add IBD, FundX, Boucher, Pitbull and other RS formulas to the formula stable when backtesting.
I thought the end result of the 3-portfolio composite model was an epic fail after all the buildup. It was basically glossed over. It should have been the climax of the book. Simply inexcusable. After that fiasco, the book’s content became progressively weaker as if the author just wanted to be done with the book.
Elias Zimmerman (verified owner) –
Michael Carr provides a blueprint for success using relative strength investing (RS). Investors may be familiar with the academic literature showing that RS investing should work, but most of these studies were performed on paper, not in the real world. Few investors have successfully integrated RS into their investment approach because of challenges including:
1) There are so many ways to measure RS that it is difficult to know which is best.
2) Transaction costs can erode all the excess profits from RS investing.
3) RS investing involves risk. What are the best ways to reduce the risks inherent in this approach?
Carr addresses these issues. Investors experienced in using RS investing might scan the first section, which summarizes various approaches to measuring RS and surveys much of the academic literature on the subject. But even advanced practitioners will benefit from later chapters in which Carr builds a complete trading system, including buying, selling, back-testing and risk management. He illustrates RS investment approaches using both mutual funds and ETFs. This book is far more than an overview of the subject. It teaches readers how to utilize the power of relative strength in their own investing and trading.