
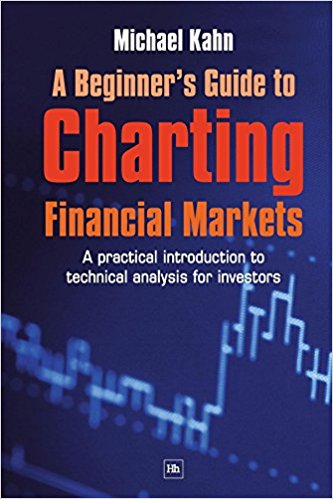
A Beginner’s Guide to Charting Financial Markets: A Practical Introduction to Technical Analysis for Investors
$12.97
A Beginner’s Guide to Charting Financial Markets: A Practical Introduction to Technical Analysis for Investors introduces chart analysis as a practical decision-making discipline for individual investors. Rather than treating technical analysis as a forecasting system, Michael Kahn focuses on using market-generated information to evaluate whether an investment should be bought, sold, held, or avoided. The book is explicitly designed for beginners and deliberately avoids excessive mathematical complexity and specialist jargon.
The methodology is built around interpreting price behavior through five interrelated components: price, volume, momentum, structure, and sentiment. Price remains the central measure, while the other elements provide supporting evidence about market participation, trend strength, supply and demand, investor psychology, and potential changes in market direction. The book also introduces bar charts, moving averages, support and resistance, trends, chart patterns, breakouts, and other foundational tools of technical analysis.
Kahn emphasizes probability and market evidence rather than prediction. Readers are taught to observe what the market is actually doing, allow trends and patterns to develop, and establish conditions that would confirm or invalidate an investment decision. This approach is applied through practical examples showing favorable candidates, stocks that should be avoided, uncertain situations, sell decisions, and cases where real market behavior does not conform neatly to textbook expectations. The book is positioned as a complement to existing investment analysis rather than a required replacement for fundamental or other methods. Its central practical value is helping investors use charts to confirm or challenge an existing investment thesis, identify unfavorable risk conditions, and respond when market behavior contradicts expectations. The second half moves from foundational concepts into real-world applications and worked chart examples.
✅ What You’ll Learn
- Read basic financial charts and understand how price is represented over time.
- Distinguish trends from consolidation patterns and identify whether a market is rising, falling, or resting.
- Interpret support and resistance as expressions of supply and demand.
- Evaluate price, volume, momentum, market structure, and sentiment as complementary components of chart analysis.
- Use moving averages and other supporting indicators without losing focus on price action.
- Recognize common chart structures including rectangles, triangles, flags, and rounded formations.
- Assess breakouts and determine whether market behavior supports a potential investment.
- Apply a structured technical test to distinguish attractive, unfavorable, and uncertain stock candidates.
- Recognize evidence that an investment thesis is failing and determine when selling may be appropriate.
- Integrate technical evidence with existing fundamental or investment research rather than relying blindly on external opinions.
💡 Key Benefits
- Provides a structured framework for converting visual market information into buy, sell, hold, or avoid decisions.
- Helps investors evaluate whether market behavior confirms or contradicts an existing investment thesis.
- Develops an evidence-based approach to recognizing changing supply, demand, momentum, and investor perception.
- Encourages disciplined risk assessment by identifying the market conditions that would invalidate an investment decision.
- Uses real-market examples to demonstrate how technical principles behave outside idealized textbook situations.
- Establishes a foundation for progressing into more advanced technical-analysis methods without requiring complex mathematics.
👤 Who This Book Is For
- Beginner to intermediate investors who need a structured introduction to chart reading and technical analysis.
- Fundamentally oriented investors who want technical evidence to confirm or challenge stock-selection decisions.
- Market participants seeking practical methods for identifying trends, support, resistance, breakouts, and changing market conditions.
- Investors who want to improve entry, avoidance, and exit decisions without adopting a professional short-term trading framework.
📚 Table of Contents
- The Basics Of Chart Reading
- How To Read A Chart
- Understanding Each Part Of A Chart
- How To Use Charts – The Basics
- Putting Stocks To The Technical Test
- Technical Analysis In Action
- When The Real World Does Not Follow The Script
A Beginner's Guide to Charting Financial Markets: A Practical Introduction to Technical Analysis for Investors By Michael N. Kahn
| Author(s) | |
|---|---|
| Product Type | Ebook |
| Format | |
| Skill Level | Beginner to Intermediate |
| Pages | 293 |
| Publication Year | 2008 |
| Delivery | Instant Download |
9 reviews for A Beginner’s Guide to Charting Financial Markets: A Practical Introduction to Technical Analysis for Investors
Only logged in customers who have purchased this product may leave a review.
Related products




Bailey Terrell (verified owner) –
This is one simple, albeit high-quality, tool that will enhance your chances of trading profitably. This book strips out the fancy indicators and gives you the basics needed to look at a chart and get a feel for what the market or the individual stock is doing. It covers the nuts and bolts of chart analysis.
Selene Webster (verified owner) –
A good entry level book – others I have tried go too in depth too soon, This is a good little starting tool
Anahi Lin (verified owner) –
An ideal starter introduction into charting basics (all you need!).
Stephanie McClure (verified owner) –
Just superb. Best PRIMER book for Long Term Investors who want to include an edge in their investment by inclusion of CHARTING in their Analytic arsenal. After a long search, I felt myself blessed to reach the perfect destination to begin with my First Step into Technical Analysis.
Cairo Christian (verified owner) –
Great service and happy with the book, easy understanding should we want to learn to trade
Emani Koch (verified owner) –
This book was very easy to understand and a great introduction to charting. BUT examples were very limited and for that reason I think for some it may be a little more difficulty to fully grasp the concepts. I don’t think this book can really help you break into the market but rather give you a general overview of what to expect, not necessarily how to play it.
With more examples, I think this book would be great for learning charting but because it lacks these examples I had to give it three stars 🙁
Rey Holmes (verified owner) –
I very much enjoyed Mr. Kahns simple no nonsense way of explaining the basics of charting. This is a great read for the new investor looking for basic information to start the learning and understanding of charting.
Conor Cooper (verified owner) –
Great reading. Good Guide for beginners!!
Wish examples were across global financial markets. A must read who want to start with technical analysis.
Jaxen Sloan (verified owner) –
Excellent read for a beginner. Still will need to continue educating, but it gets you entranced into it to start. Little dated for examples, but still the underlying concept is there. This is my recommendation for a first read always.